FIGURE 5.
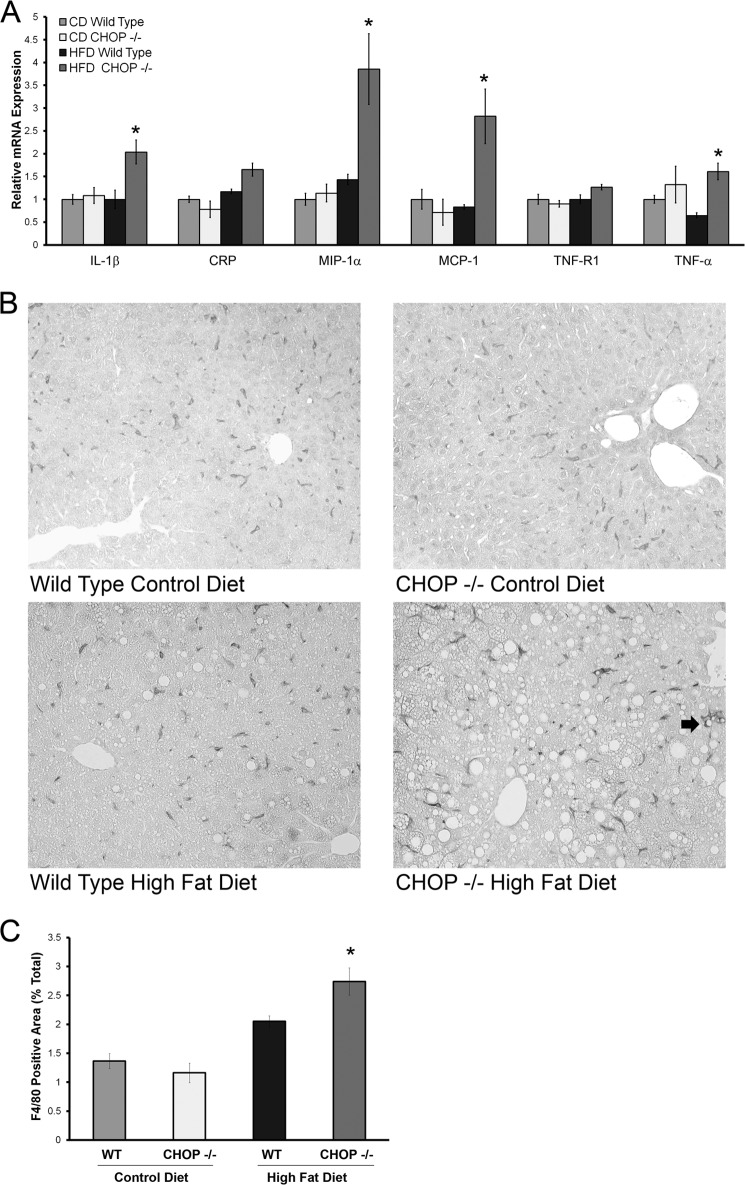
Inflammation and Kupffer cell activation in HFD-fed CHOP knock-out (Chop−/−) mice. A, relative gene expression of several inflammatory markers from livers of CD and HFD fed mice is shown. A significant increase in expression of interleukin 1β (IL-1β), MIP-1α, MCP-1, and TNF-α was seen (*, p < 0.05, compared with HFD-fed Chop+/+). B, representative photomicrographs of F4/80-stained liver sections from CD and HFD-fed Chop+/+ and Chop−/− mice are shown. The arrow in the bottom right picture points to a cluster of F4/80-positive cells in HFD-fed Chop−/− liver. C, quantitative morphometry for the F4/80-positive area expressed as a percent of total area of each liver section is shown. In HFD-fed Chop−/− there was a significant increase in F4/80 positive surface area (p < 0.05 compared with HFD-fed Chop+/+).

