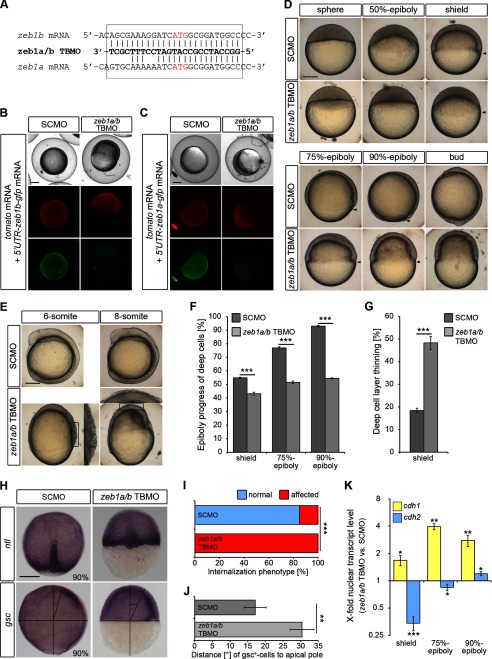
FIGURE 2.
Depletion of both zeb1 paralogs (zeb1a and zeb1b) causes severe gastrulation defects. A, sequence of zeb1a/b TBMO aligned with the translational start site region of zeb1b and zeb1a mRNA is shown. The start codons (ATG) are depicted in red. The zeb1a/b TBMO was designed against the initiation start site of zeb1b and has six nucleotides mismatched with the paralog zeb1a. B and C, MO specificity was demonstrated by knockdown of GFP reporter expression. Embryos were injected with nls-tomato mRNA (50 pg), gfp-reporter mRNA (50 pg) (5′UTR-zeb1b-gfp mRNA (B) and 5′UTR-zeb1a-gfp mRNA (C)) and either SCMO (4 ng) or zeb1a/b TBMO (4 ng) and assayed for NLS-Tomato and GFP expression 8 h later. The fusion reporter construct 5′UTR-zeb1b-gfp mRNA contains the zeb1b mRNA sequence depicted in the box in A fused to the gfp coding sequence. The fusion reporter construct 5′UTR-zeb1a-gfp mRNA contains the zeb1a mRNA sequence depicted in the box in A fused to the gfp coding sequence. zeb1a/b morphants expressed NLS-Tomato comparable to control embryos but showed less expression of both GFP reporters, indicating that the zeb1a/b TBMO not only reduces translation of zeb1b but also efficiently binds to the translational start site region of zeb1a. D and E, live WT embryos were injected with SCMO or zeb1a/b TBMO at the indicated stages. Lateral views are shown, with the animal pole toward the top and dorsal to the right. Arrowheads indicate vegetal front of blastoderm. Scale bar, 200 μm. F and G, shown is quantification of epiboly progress and deep cell layer thinning in SCMO-injected embryos and zeb1a/b double morphants shown in D (shield, n = 14 embryos each; 75% epiboly, n = 13 embryos each; 90% epiboly, n = 15 embryos each). Values are the mean ± S.E. H, shown is whole-mount ISH of SCMO-injected embryos and zeb1a/b double morphants. Embryos were hybridized with no tail (ntl) (upper panel) antisense probe to evaluate the internalization movement of axial mesodermal cells or goosecoid (gsc) (lower panel) antisense probe to evaluate the migration of prechordal cells toward the animal pole. Dorsal views (upper panels) are shown with the animal pole to the top. Lateral views (lower panels) with are shown with the dorsal to the right. The angle between the foremost prechordal cells and the animal pole is depicted in the lower panels. Scale bar, 200 μm. I, quantification of the internalization phenotype (n = 20 embryos each) shown in H. J, shown is quantification of the deficit in prechordal mesoderm migration toward the animal pole (n = 15 embryos each) shown in H. Values are the mean ± S.E. K, shown is the time series qRT-PCR data of cdh1 mRNA (yellow) and cdh2 mRNA (blue) expression in nuclear extracts of zeb1a/b double morphants relative to SCMO-injected embryos (shield, n = 6; 75% epiboly, n = 4; 90% epiboly, n = 4). Expression values were normalized to rpl5b. cdh1 and cdh2 expression in SCMO-injected embryos was set to 1. Values are the mean ± S.E.

