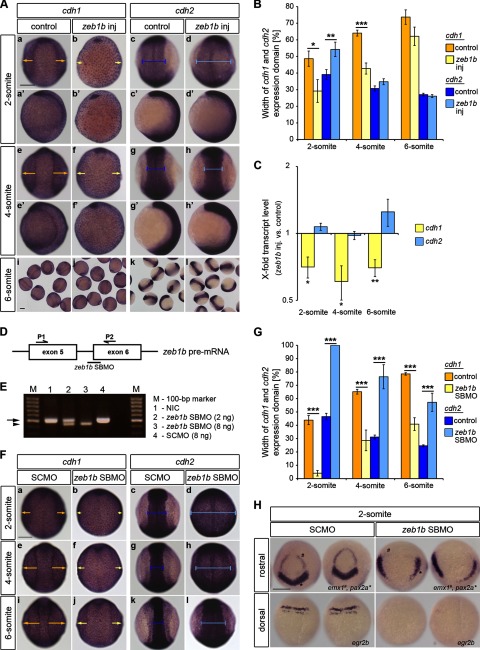
FIGURE 4.
Zeb1b overexpression and knockdown affect convergence movements. A, shown is whole-mount ISH of control and zeb1b-overexpressing embryos. Embryos were hybridized with either a cdh1 (a–b′, e–f′, i, and j) or cdh2 (c–d′, g–h′, k, and l) antisense probe at the indicated developmental stages. In all dorsal views (a–h) animal pole is to the top. In all lateral views (a′–h′) dorsal is to the right. Yellow arrows indicate the width of the cdh1 expression domain, corresponding to the non-neural ectoderm. Blue bars indicate the width of the cdh2 expression domain, corresponding to the neural ectoderm. Scale bar, 200 μm. B, shown is quantification of the width of cdh1 (yellow) and cdh2 (blue) expression domains (2-somite, n = 13 embryos each for cdh1 and n = 14 embryos each for cdh2; 4-somite, n = 47 embryos each for cdh1 and n = 43 embryos each for cdh2; 6-somite, n = 17 embryos each for cdh1 and n = 16 embryos each for cdh2). Values are the mean ± S.E. C, shown is the time series qRT-PCR data of cdh1 mRNA (yellow) and cdh2 mRNA (blue) expression in zeb1b-overexpressing embryos relative to control embryos (n = 4 each for all stages). Expression values were normalized to rpl5b. cdh1 and cdh2 expression in control embryos was set to 1. Values are the mean ± S.E. D, shown is a schematic illustration of the zeb1b pre-mRNA exon5–6 region and the location of the zeb1b-specific SBMO (black bar; zeb1b SBMO) as well as the positions of primers used for the RT-PCR reactions (black half-arrows; P1 and P2). E, the agarose gel shows PCR products from various conditions. Lane 1, shown is the RT template from non-injected control embryos (NIC). Lane 2, shown is the RT template from embryos injected with 2 ng of zeb1b SBMO. Lane 3, shown is the RT template from embryos injected with 8 ng zeb1b SBMO. Lane 4, shown is the RT template from embryos injected with 8 ng of SCMO. The black arrow indicates the expected WT PCR product of 505 bp. The arrowhead indicates the shorter PCR product appearing after zeb1b SBMO injection. Template cDNA was generated from 75% epiboly stage embryos. The zeb1b SBMO (intron 5 exon 6; i5e6) targets the splice acceptor site of exon 6. Based on sequencing of amplified cDNA zeb1b SBMO leads to the deletion of the first 60 nucleotides of exon 6 that partially code for the fourth zinc finger of Zeb1b. F, shown is whole-mount ISH of SCMO- and zeb1b SBMO-injected embryos. Embryos were hybridized with either a cdh1 (a, b, e, f, i, and j) or cdh2 (c, d, g, h, k, and l) antisense probe at the indicated developmental stages. Dorsal views are shown with the animal pole to the top. Yellow arrows indicate the width of the cdh1 expression domain, corresponding to the non-neural ectoderm. Blue bars indicate the width of the cdh2 expression domain, corresponding to the neural ectoderm. Scale bar, 200 μm. G, shown is quantification of the width of cdh1 (yellow) and cdh2 (blue) expression domains (2-somite, n = 8 embryos (SCMO) and n = 7 embryos (zeb1b SBMO) for cdh1 and n = 12 embryos (SCMO) and n = 10 embryos (zeb1b SBMO) for cdh2; 4-somite, n = 11 embryos (SCMO) and n = 5 embryos (zeb1b SBMO) for cdh1 and n = 10 embryos (SCMO) and n = 7 embryos (zeb1b SBMO) for cdh2; 6-somite, n = 10 embryos (SCMO) and n = 8 embryos (zeb1b SBMO) for cdh1 and n = 10 embryos (SCMO) and n = 7 embryos (zeb1b SBMO) for cdh2). Values are the mean ± S.E. H, shown is whole-mount ISH of SCMO-injected embryos and zeb1b morphants. Embryos were hybridized with emx1 and pax2a (upper panel) and egr2b (lower panel) antisense probe. Rostral views (upper panels) are shown with the ventral toward the top. Dorsal views (lower panels) are shown with the animal pole toward the top. Scale bar, 200 μm.

