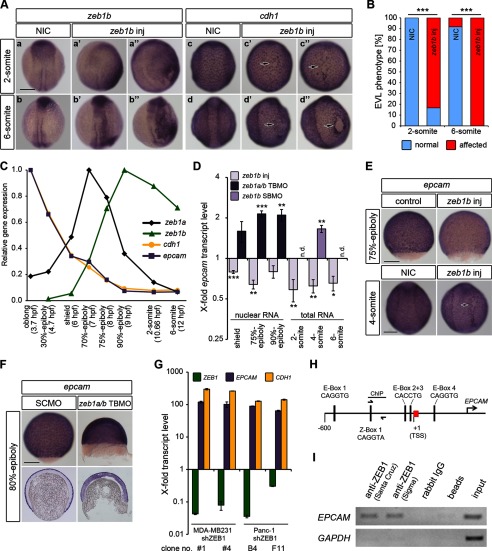
FIGURE 5.
Human ZEB1 and the zebrafish paralogs Zeb1a and Zeb1b control EPCAM (epcam) expression. A, shown is whole-mount ISH of non-injected control embryos (NIC) and zeb1b-overexpressing embryos (zeb1b inj). RNA was injected into one blastomere of 4-cell stage embryos. The amount of injected zeb1b mRNA per cell was 4-fold higher as compared with Fig. 4A. Embryos were hybridized with either a zeb1b (a–b′) or cdh1 (c–d′) antisense probe at the indicated developmental stages. All embryos are orientated in a dorsal view with the animal pole toward the top. Black arrows indicate affected EVL integrity (quantified in B). Scale bar, 200 μm. B, shown is quantitative analysis of the EVL phenotype shown in A (n = 12 embryos each). C, transcript levels of zeb1a (black), zeb1b (green), cdh1 (yellow), and epcam (purple) during early WT embryo development (3.7–12 hpf) were quantified by qRT-PCR. Expression was normalized to rpl5b. Expression levels of analyzed genes are presented relative to the highest expression of each gene (set to1) during analyzed time points. D, shown is a time series qRT-PCR data of nuclear or total epcam mRNA expression in zeb1b-overexpressing embryos, zeb1a/b morphants, and zeb1b morphants relative to control embryos (n = 3–6 per condition). Expression values were normalized to rpl5b. epcam expression in control embryos was set to 1. Values are the mean ± S.E.; n.d., not determined. E, whole-mount ISH of control and zeb1b-overexpressing embryos is shown. In the upper panel embryos were injected with control gfp mRNA or zeb1b mRNA at the one-cell stage. In the lower panel non-injected control embryos and zeb1b-overexpressing embryos (zeb1b inj), where zeb1b RNA was injected into one blastomere of 4-cell stage embryos, are depicted. Embryos were hybridized with an epcam antisense probe at the indicated stages. Dorsal views are shown with the animal pole toward the top. Scale bar, 200 μm. F, shown is whole-mount ISH (upper panel) and sagittal sections through stained embryos (lower panel) injected with SCMO or zeb1a/b TBMO and hybridized with a probe against epcam at 80%-epiboly. Scale bar, 200 μm. G, shown are transcript levels of ZEB1 (green), EPCAM (purple), and CDH1 (yellow) in characteristic short hairpin control (shGFP), and shZEB1 knockdown clones of human breast (MDA-MB231) and human pancreatic (Panc-1) cancer cell lines were quantified by qRT-PCR. Expression was normalized to β-actin. ZEB1, EPCAM, and CDH1 mRNA expression is relative to control clone MDA-MB231 shGFP #1 and Panc-1 shGFP D4. Expression in control clones was set to 1. Values represent the mean ± S.E. of technical triplicates. H, shown is a schematic representation of the putative promoter of human EPCAM on chromosome 2p21. The sequence-predicted ZEB1 binding sites (E-boxes 1–4 and Z-box 1) and the region amplified for ChIP are indicated. Primers used for ChIP analysis are shown as half-arrows. All numbers are in bp relative to the transcription start site (TSS) of EPCAM. I, ChIP shows in vivo binding of ZEB1 to the putative promoter of human EPCAM. Lysates from MDA-MB231 cells were subjected to ChIP by two different anti-ZEB1 antibodies (from Santa Cruz or Sigma). Rabbit IgG and a chromatin sample without the addition of antibody (beads) were used as negative controls. 5% of the supernatant of the antibody isotype control after immunoprecipitation was used as the input control. Eluted DNA was subjected to PCR for EPCAM promoter. GAPDH promoter was used as negative control.

