FIGURE 6.
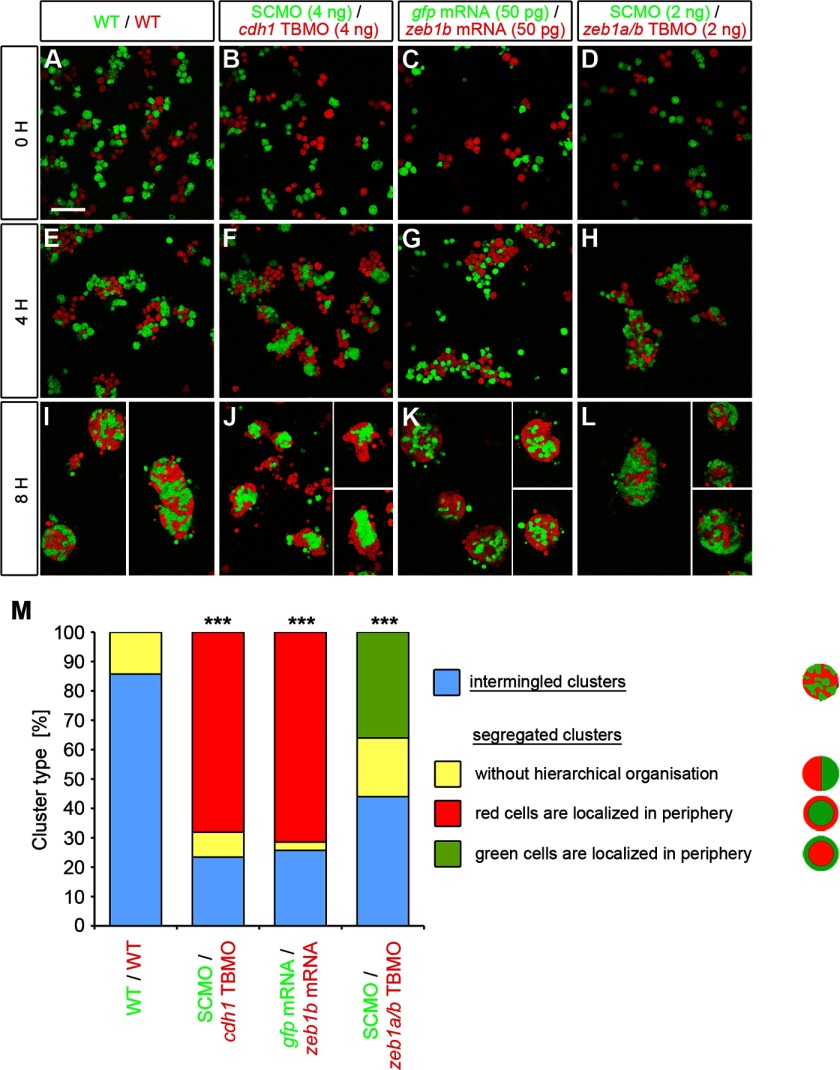
Zeb1 controls blastoderm cell cohesiveness. A—L, embryos were microinjected at the one-cell stage with mRNA or MOs as indicated at the top of the panels together with either Alexa488-dextran (green) or rhodamine-dextran (red) were mixed at sphere stage in equal proportions in vitro and dissociated. Primary co-cultures of those sphere stage embryo cells were plated on fibronectin-coated dishes and allowed to re-aggregate for 8 h. Proper dissociation was controlled within the first hour after plating (A–D). Four hours after plating, cells began to form clusters (E–H). Cell clusters were imaged after 8 h of incubation (I–L) and categorized as intermingled or separated. Scale bar, 100 μm. M, shown are measurements of the percentage of intermingled and segregated clusters. Segregated clusters were further classified in clusters without hierarchical organization of green and red cells (yellow), clusters where the red cells surround the green cells (red), and clusters where the green cells surround the red cells (green). p values are versus WT/WT control. Number of analyzed clusters are n = 35 for WT/WT, n = 47 for SCMO/cdh1 TBMO, n = 35 for gfp mRNA/zeb1b mRNA, and n = 50 for SCMO/zeb1a/b TBMO.

