FIGURE 3.
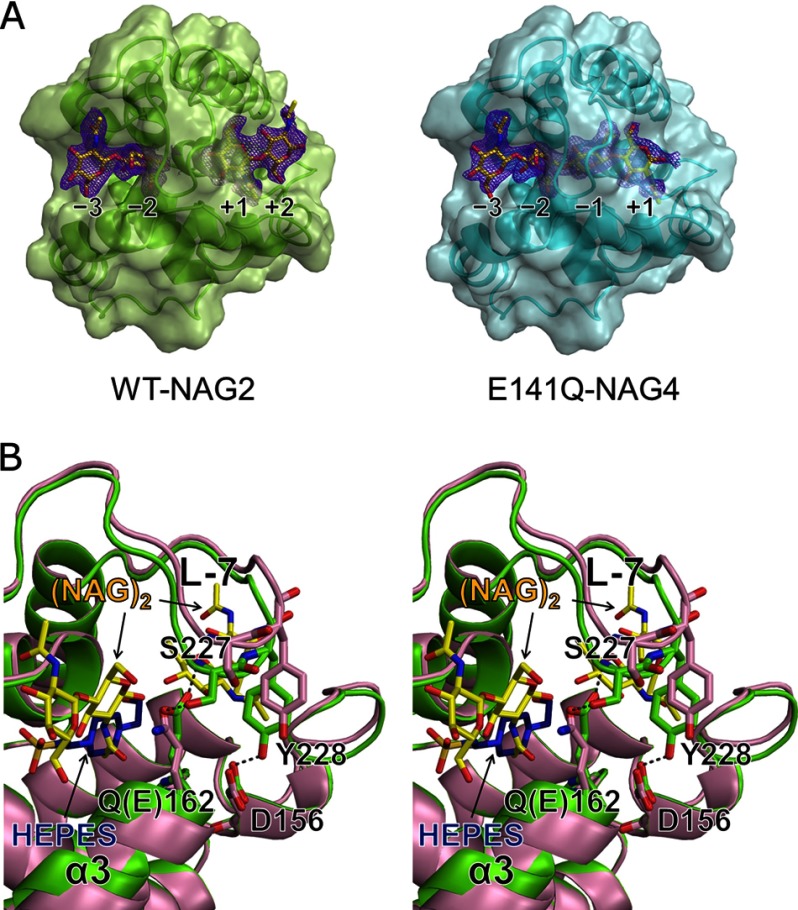
Comparison of Ra-ChiCcat structures. A, crystal structures of Ra-ChiCcat complexed with (NAG)n. WT-NAG2 (left) and E141Q-NAG4 (right) structures with transparent surface models are shown in light green and cyan, respectively. Bound NAG residues are shown as yellow stick models. Initial Fo − Fc maps (contoured at 2.0σ) before the sugar model were included are shown in purple. B, stereo diagram showing conformational changes observed at α3 and L-7 between WT-NAG2 (light green) and E162Q-HEPES (light magenta) structures. Bound NAG residues and HEPES molecule are shown as yellow and blue stick models, respectively. Hydrogen bonding interactions are shown as gray dashed lines.

