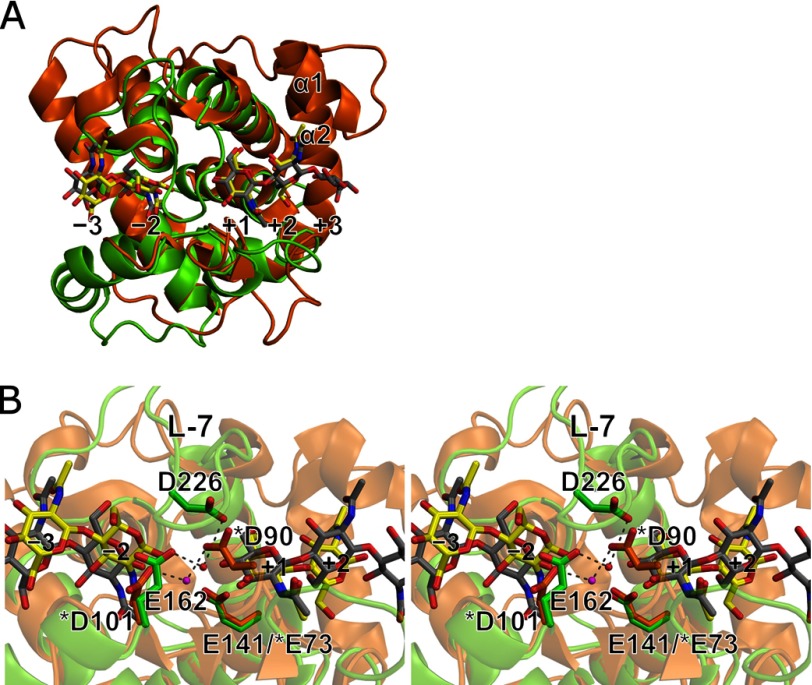
FIGURE 6.
Structural comparison between Ra-ChiCcat and AcLYZ. A, superposition of the overall structures of WT-NAG2 (light green) and AcLYZ-NAG (orange). Bound NAG residues in WT-NAG2 and AcLYZ-NAG are shown as yellow and gray stick models, respectively. B, stereo diagram of active site superposition of the WT-NAG2 (light green) and AcLYZ-NAG (orange) structures. Acidic residues at each active site are shown as stick models. The catalytic water molecules observed in the WT-NAG2 and AcLYZ-NAG structures are shown as red and magenta spheres, respectively. AcLYZ residue numbers are indicated by asterisks.

