
FIGURE 2.
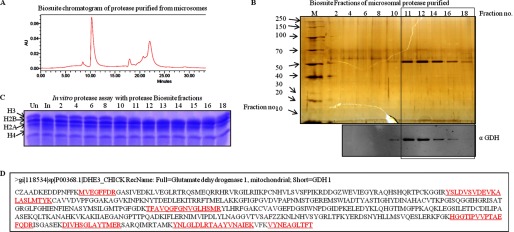
Purification of H3 protease activity from chicken liver microsomes. A, shown is biosuite 125 size-exclusion column chromatography of purified protease (Fig. 1B). B, fractions from Biosuite 125 size-exclusion column (final step in the purification protocol) were analyzed on 10% SDS-PAGE (upper panel). M stands for protein marker/ladder. Numbers on the top of the gel picture denote fraction numbers. Western analysis of the same fractions was performed using anti-GDH (anti-GLUD1) antibody to determine the presence of GDH (lower panel). C, the histone-clipping assay using the Biosuite 125 column fractions (numbers on top of the lanes) show the activity of the protease. Un, undigested brain core histones for control. In, input The contents of H3-clipping assay were resolved by 15% SDS-PAGE. D, shown is mass-spectrometric identification of the protease band purified after the Biosuite 125 column. The sequence is chicken GDH. The sequences in red underlined font are the sequences of the peptides detected and are identified by mass spectrometry.