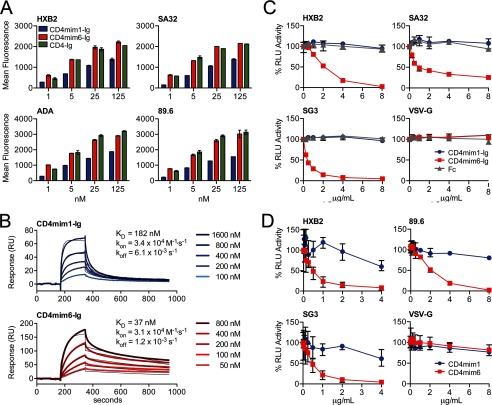
FIGURE 3.
Comparisons of CD4mim1-Ig and CD4mim6-Ig. A, binding of CD4mim-Ig variants and CD4-Ig to 293T cells transfected to express the trimeric envelope glycoproteins of the indicated clade B (HXB2, ADA, 89.6) and clade C (SA32) isolates. Binding was determined by flow cytometry using a goat anti-human secondary antibody. Background binding, determined using Fc domain alone, was <15 mean fluorescence intensity in each case. Experiment is representative of two with similar results. B, surface plasmon resonance studies of CD4mim1-Ig and CD4mim6-Ig using immobilized gp120 of the clade C isolate Du151. Results are shown with thick lines. Thin black lines represent global fitting of the data to a 1:1 Langmuir binding model. C, CD4mim6-Ig neutralizes clade B (HXB2) and clade C (SG3, SA32) HIV-1 isolates with IC50 values of 1–2 μg/ml (20–40 nm), whereas no neutralization was observed for CD4mim1-Ig at 8 μg/ml (160 nm), and HIV-1 pseudotyped with VSV-G protein was unaffected by any Fc fusion. Experiment is representative of three with similar results. D, synthetic monomers of CD4mim1 and CD4mim6 were compared in the same assay. CD4mim6 neutralized the indicated isolates with IC50 values in the 0.5–2 μg/ml range, whereas IC50 values for CD4mim1 were >4–8 μg/ml. Experiment is representative of two with similar results. Error bars in all cases represent a range of duplicates (A) or triplicates (C and D).

