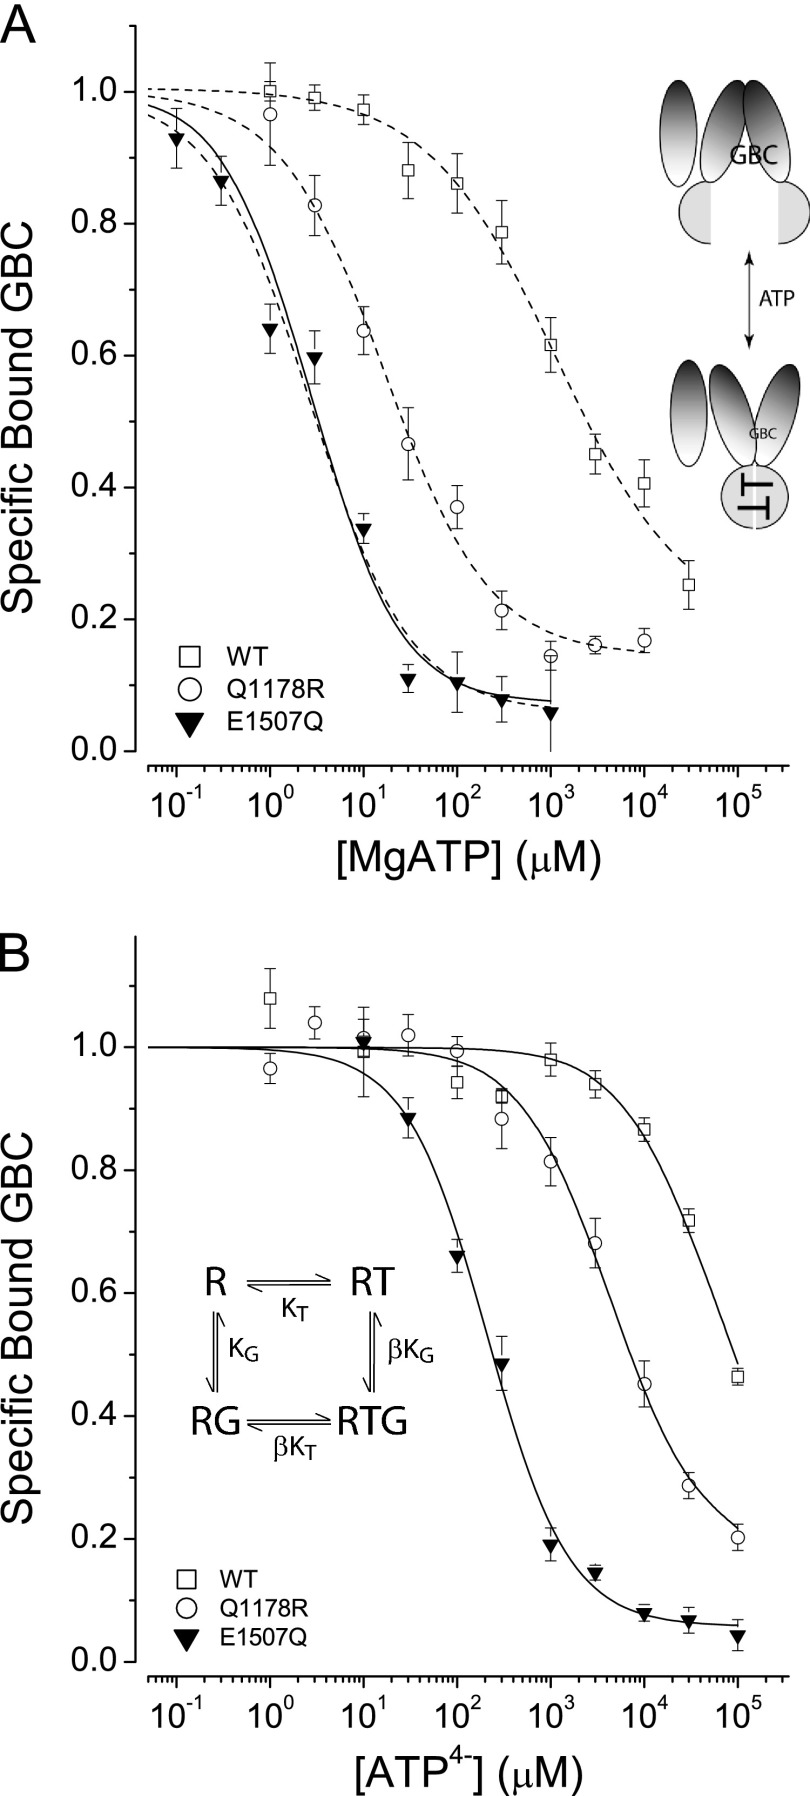
FIGURE 1.
ATP-induced conformational switching of SURs. A, the effect of MgATP on GBC binding. Dashed curves are fits to a logistic equation used to estimate the IC50 values (in μm): WT: 1163 ± 439, slope = 0.8 ± 0.1; Q1178R: 17 ± 3, slope = 0.8 ± 0.1; E1507Q: 2.7 ± 0.4, slope = 0.8 ± 0.1. IC50 mean ± S.E., slope mean ± S.E., n = 3–20. The solid curve for SUR1E1507Q is the best fit to the four-state model shown in the inset. The parameters are KT = 1 μm and β = 40 with a defined value for KG = 0.63 nm. B, the effect of ATP4− on GBC binding. The curves are the best fits to the four-state model. The parameters are KT = 94, 2550, and 13,400 μm and β = 40, 9.2, and 15.1 with KG defined as 0.63, 1.0, and 0.25 nm, for E1507Q, Q1178R, and WT, respectively. Here and in the following figures, the graphics suggest the conformational changes in SUR1 upon binding of nucleotides.

