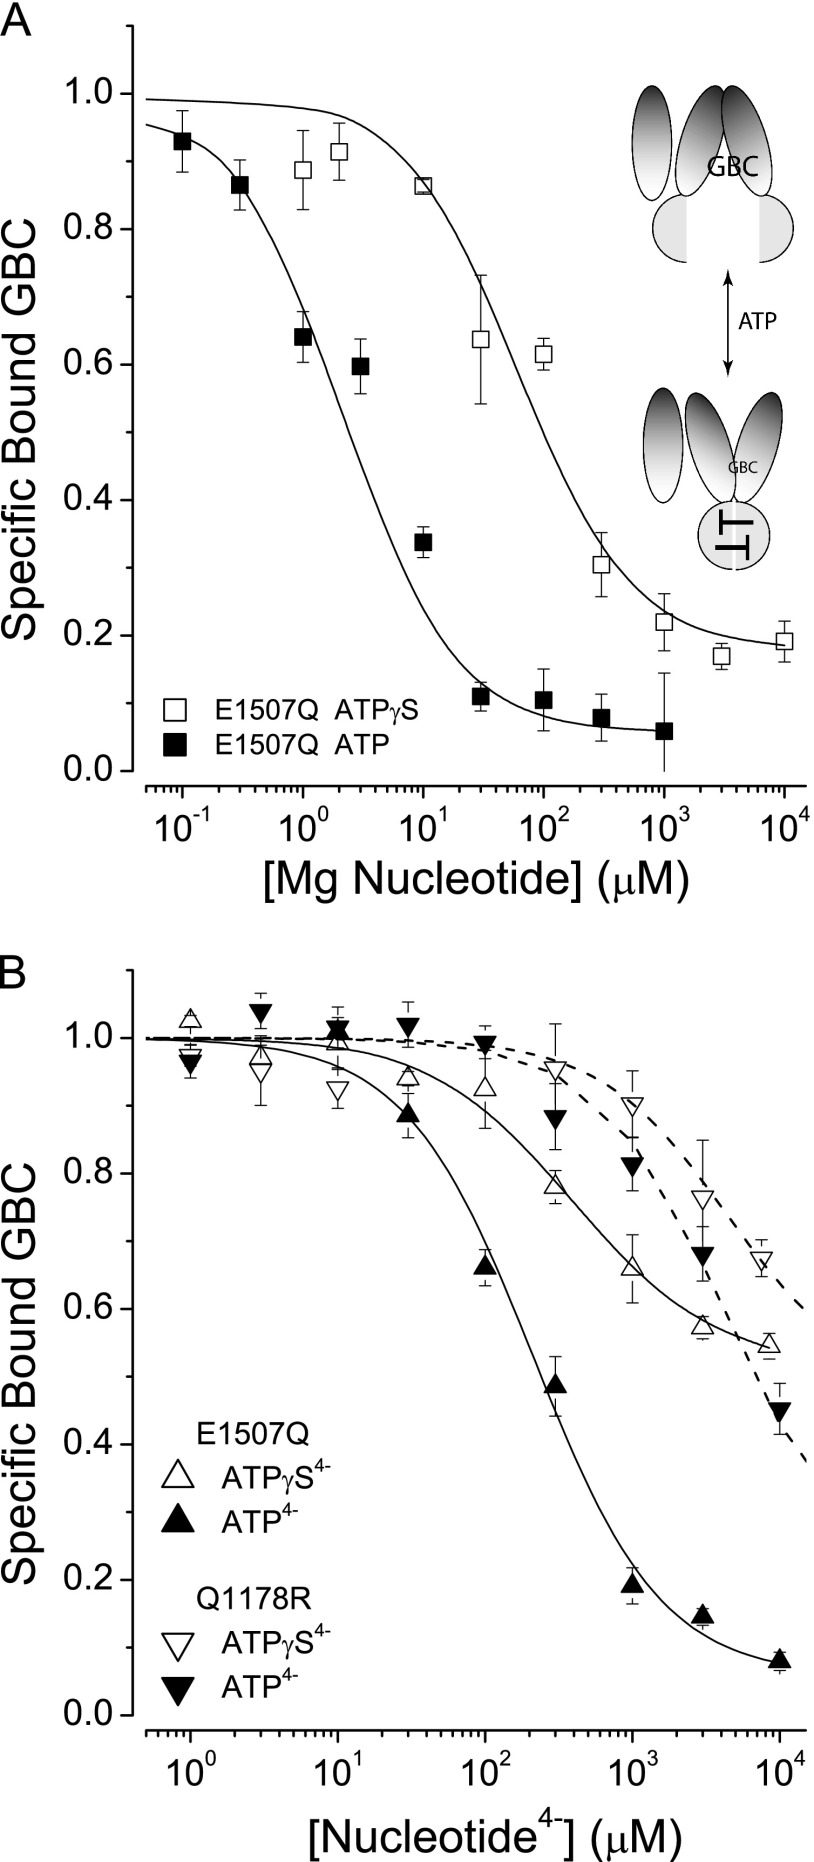
FIGURE 3.
SURs have reduced affinity for ATPγS versus ATP. A, comparison of MgATPγS versus MgATP effects. The curves are best fits to a four-state model (Fig. 1B, inset). The best-fit dissociation constants are KT = 1 and 29 μm for MgATP and MgATPγS, respectively. The β values are 40 and 11.6 for MgATP and MgATPγS, respectively. The dissociation constant, KG = 0.63 nm for GBC, was determined independently. B, comparison of the affinities of SUR1E1507Q for ATP4− versus ATPγS4−. The solid curves are the best fits to the four-state model; the parameters are KT = 94 versus 234 μm; β = 40 versus 3.2, ATP4− versus ATPγS4−, respectively. The dissociation constant for GBC, KG = 0.63 nm, was fixed during fitting.

