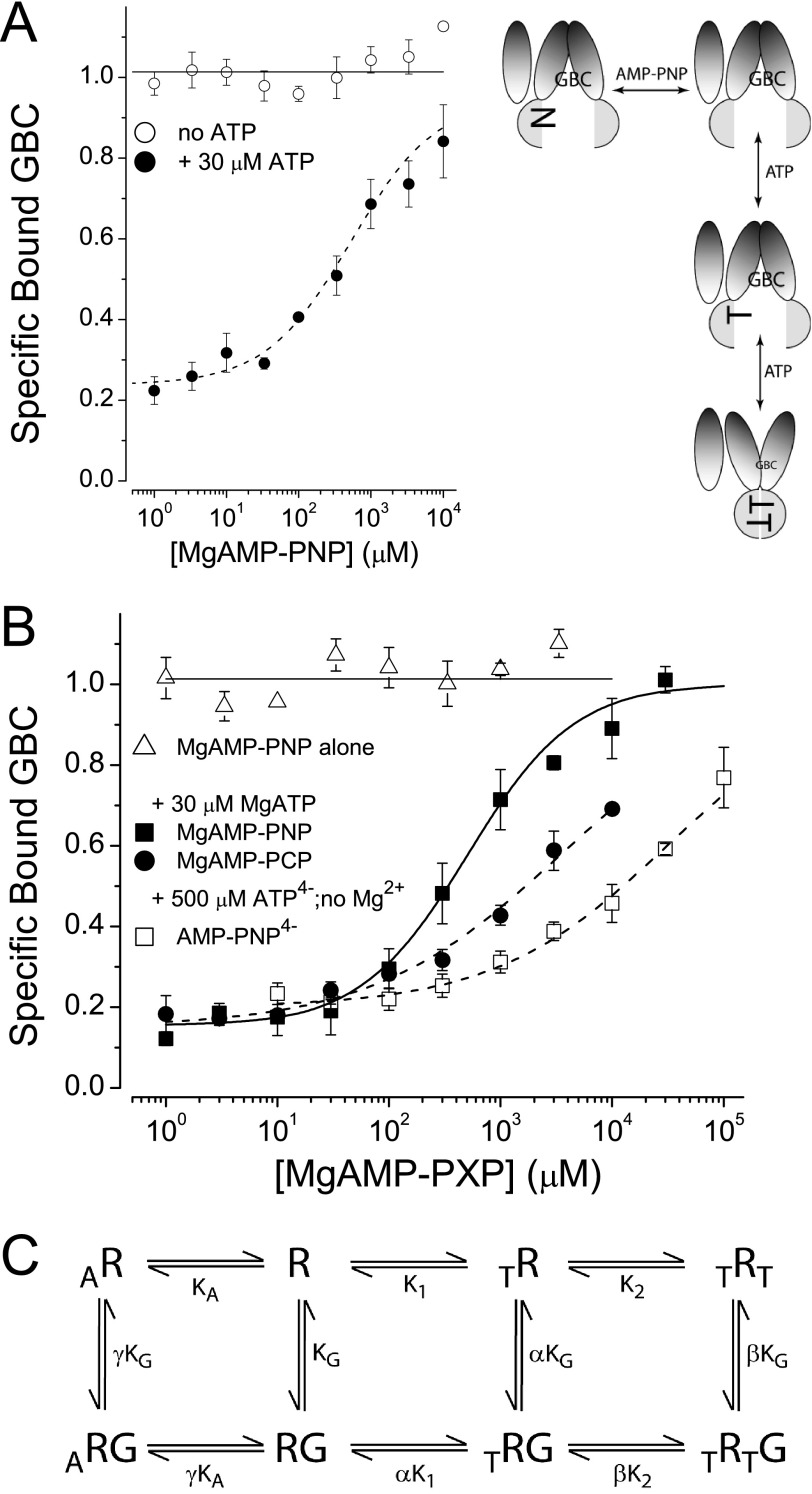
FIGURE 4.
AMP-PxP reverse ATP-induced conformational switching. A and B, MgAMP-PNP alone does not affect the conformational state of SUR1Q1178R (A) or SUR1E1507Q (B). MgAMP-PNP reverses the conformational shift induced by MgATP (30 μm) in both SURs. MgAMP-PCP and AMP-PNP4− also reverse, but the apparent affinities are lower. The dashed lines are logistic curves through the data points; the parameters are S0.5 = 530 ± 124 μm for SUR1Q1178R (A). The SUR1E1507Q S0.5 values in B are 573 ± 103, 3360 ± 410, and 31,100 ± 2240 μm for MgAMP-PNP, MgAMP-PCP, and AMP-PNP4−, respectively. C, the solid curve in B for SUR1E1507Q is a fit to an eight-state model with the following parameters: α = γ = 1, β = 40, KG = 0.63 nm, K1 = 0.7 ± 0.2 μm, K2 = 1.5 ± 0.1 μm, KA = 1.2 ± 0.2 μm.

