
FIGURE 5.
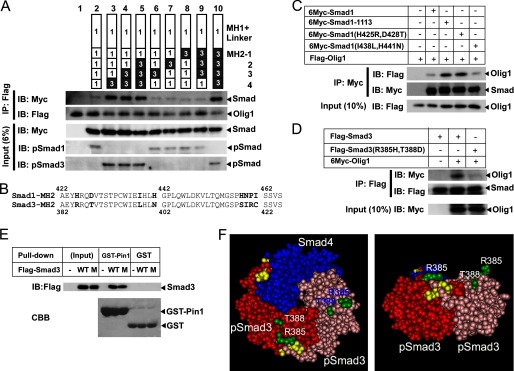
Mapping of the Olig1-binding region in Smad3. A, physical interaction of Olig1 with Smad1/3 chimeric proteins. COS-7 cells were transfected with FLAG-Olig1 and 6Myc-Smad1/3 chimeric proteins, together with constitutively active forms of BMP receptor type IB (ALK-6) and TGF-β type I receptor (ALK-5). Chimeric proteins used are schematically presented in the top panel. Domains or regions derived from Smad1 are shown as open boxes; those from Smad3 are shown as filled boxes. Smad was not transfected into the sample in lane 1. Olig1 was immunoprecipitated (IP) with anti-FLAG antibody; co-precipitated Smad1/3 chimeric proteins were visualized by immunoblotting (IB, middle panels). Input and C-terminal phosphorylation of Smad1/3 chimeric proteins are also shown (bottom panel). B, alignment of amino acid sequences of the region 4 of Smad1 and Smad3. Diverged residues are shown in bold. C, physical interaction of Olig1 with Smad1 mutants, Smad1–1113 (Smad1 with region 4 of the MH2 domain from Smad3), Smad1(H425R,D428T) or Smad1(I438L,H441N). COS-7 cells were transfected with FLAG-Olig1 and 6Myc-Smad1 mutants, together with constitutively active TGF-β type I receptor (ALK-5) and BMP receptor type IB (ALK-6). Smad1 mutants were immunoprecipitated with anti-Myc antibody; co-precipitated Olig1 was visualized by immunoblotting. Input of Olig1 is also shown (bottom panel). D, physical interaction of Olig1 with a Smad3 mutant (R385H,T388D). COS-7 cells were transfected with FLAG-Smad3 or Smad3(R385H,T388D) and 6Myc-Olig1, together with constitutively active TGF-β type I receptor (ALK-5) and BMP receptor type IB (ALK-6). Smad3 was immunoprecipitated with anti-FLAG antibody; co-precipitated Olig1 was visualized by immunoblotting. Input of Olig1 is also shown (bottom panel). E, in vitro interaction of GST-Pin1 with a Smad3 mutant (R385H,T388D). COS-7 cells were transfected with FLAG-Smad3 or Smad3 mutant (R385H,T388D) 24 h before harvest. Cell lysates were then incubated with GST-Pin1 or GST, and subjected to GST pulldown followed by immunoblotting with an anti-FLAG antibody. The top panel displays input protein expression and the interaction. The lower panel shows GST-Pin1 or GST visualized by Coomassie Brilliant Blue (CBB) staining. F, three-dimensional structural model of the MH2 domain of the phospho-Smad3–phospho-Smad3–Smad4 trimeric complex (Protein Databank code 1U7F). The left panel shows a view from the C-terminal side of the trimeric complex. The right panel shows a side view (the C-terminal side is placed upward). The C-terminally phosphorylated serine residues are shown in yellow; the Olig1-binding determinant is shown in green.