FIGURE 2.
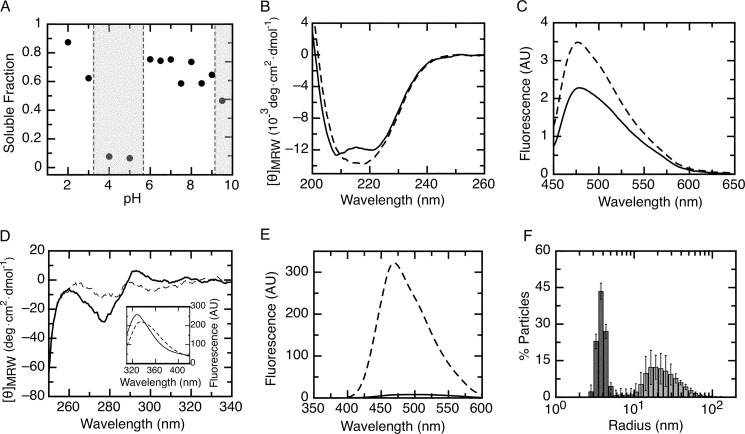
Native conformation of the RbAB domain. A, fraction of soluble RbAB protein remaining after a 1-h incubation at pH values ranging from pH 2.0 to pH 9.5. The fraction of protein remaining in solution was quantified by UV spectroscopy with the pH ranges where aggregation occurred marked as gray shaded areas. RbAB concentration was 1 μm. B, far-UV CD spectrum of the RbAB domain at pH 7.0 (full line) and 2.0 (broken line). C, ThT fluorescence emission spectrum in 100 mm citrate-Tris buffer in the presence of RbAB at pH 7.0 (full line) and 2.0 (broken line). The emission spectrum of ThT alone was subtracted from each trace. D, near-UV CD spectrum of the RbAB domain at pH 7.0 (full line) and 2.0 (broken line). Inset, RbAB tryptophan emission spectrum at pH 7.0 (full line) and 2.0 (broken line). E, ANS fluorescence emission spectrum in 100 mm citrate-Tris buffer in the presence of RbAB at pH 7.0 (full line) and 2.0 (broken line). The emission spectrum of ANS alone was subtracted from each trace. F, particle size distribution of a 10 μm RbAB sample at pH 7.0 (dark gray bars) and 2.0 (light gray bars) measured by dynamic light scattering. The average particle size populations were RS = 3.85 ± 0.07 nm (pH 7.0) and RS = 23 ± 4 nm (pH 2.0). AU, arbitrary units; deg, degrees. Error bars represent standard deviations.

