FIGURE 3.
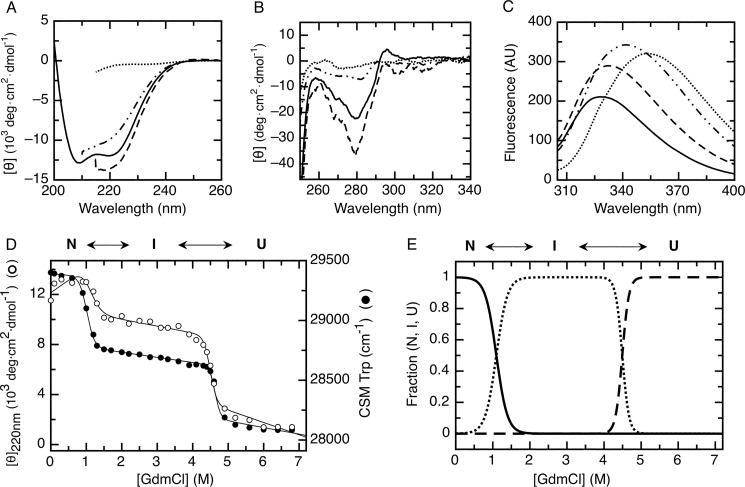
GdmCl equilibrium unfolding of the RbAB domain. Far-UV CD spectra (A), near-UV CD spectra (B), and intrinsic tryptophan fluorescence spectra (C) of 1 μm RbAB at 0 m GdmCl (full line), 0.8 m GdmCl (dashed line), 3 m GdmCl (dashed and dotted line), and 6 m GdmCl (dotted line) are shown. D, RbAB equilibrium unfolding transition followed by monitoring molar ellipticity at 220 nm (CD; open circles) and tryptophan fluorescence CSM (black circles). Protein concentration was 1 μm. Fits for each signal obtained from Equation 4 are plotted as full lines. E, fraction of N, I, and U species as a function of GdmCl concentration plotted using Equations 5–9 and the parameters obtained from fitting of the denaturation curves (Table 1). The species populated at different GdmCl concentrations are indicated above the graph. AU, arbitrary units; deg, degrees.

