FIGURE 5.
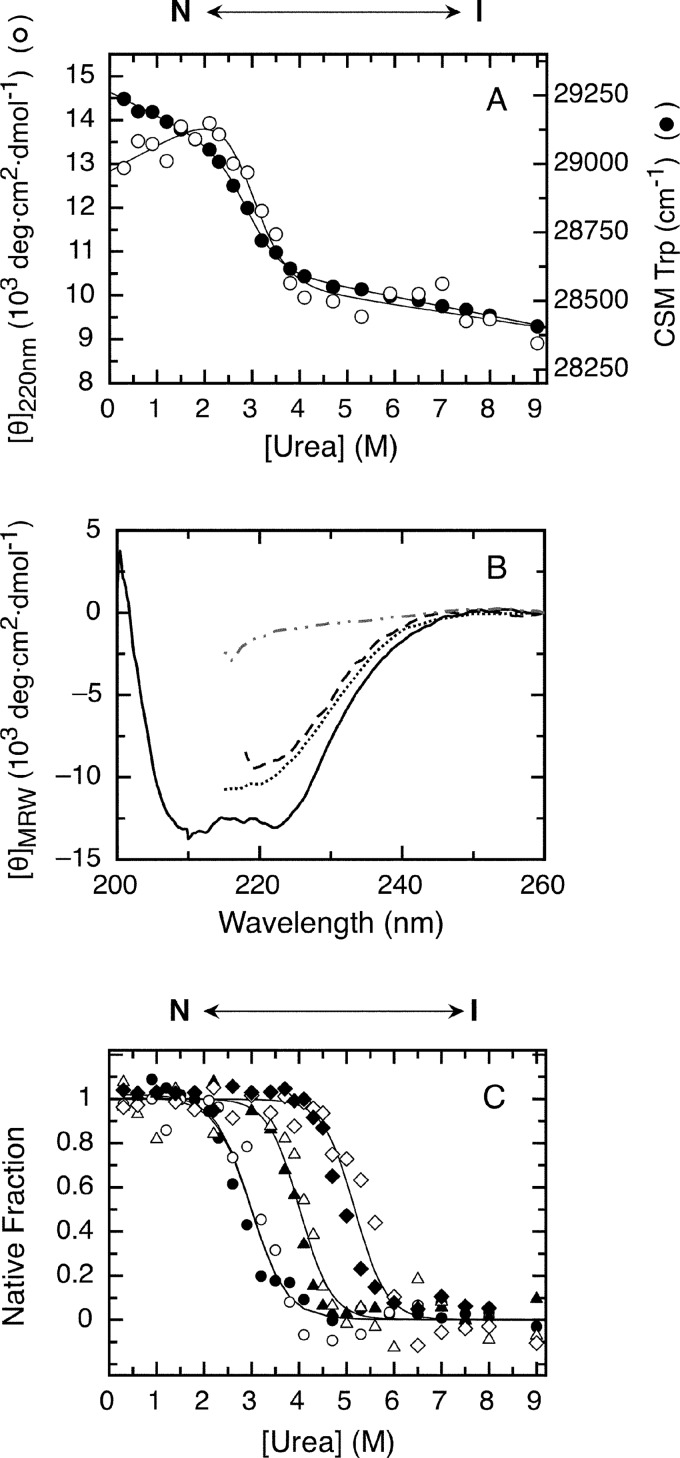
Urea denaturation and effect of peptide ligands on RbAB equilibrium unfolding. A, RbAB equilibrium unfolding followed by molar ellipticity at 220 nm (CD; open circles) and tryptophan fluorescence CSM (black circles). Lines are global fits to a two-state denaturation model (Equation 10 and Table 1). Protein concentration was 1 μm. B, far-UV CD spectra of 1 μm RbAB in 0.3 m urea (full line), 4.0 m urea (dashed line), 3 m GdmCl (dotted line), and 6 m GdmCl (dashed and dotted line). C, fraction of native protein as a function of urea concentration for the isolated RbAB domain (CD, open circles; CSM, black circles) and for complexes of 1 μm RbAB with 10 μm E2FTD (CD, open triangles; CSM, black triangles) and 1 μm RbAB with 10 μm E7(16–31) (CD, open diamonds; CSM, black diamonds). Lines are global fits of the CD and CSM signals to Equation 14. Parameters from global fitting are reported in Tables 1 and 2. The species populated at different urea concentrations are depicted above the graphs. deg, degrees.

