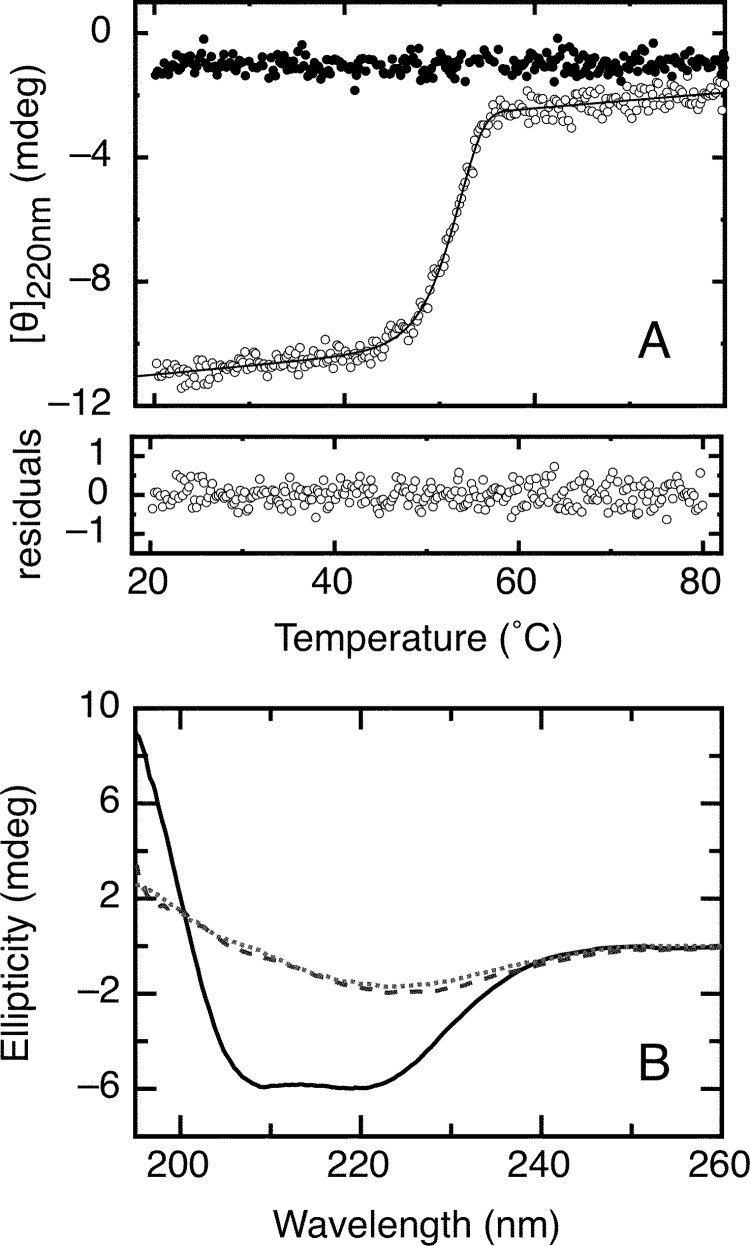
FIGURE 6.
Irreversible thermal denaturation of the RbAB domain. A, RbAB irreversible thermal denaturation scans. The far-UV CD ellipticity signal at 220 nm was recorded as temperature increased from 20 to 80 °C (open circles) or decreased from 80 to 20 °C (black circles) at a scanning speed of 3 °C/min. Protein concentration was 2 μm in a 0.1-cm-path length cell. Data were fit to Equation 16 (see “Experimental Procedures”), obtaining a Tm(app) value of 52.2 ± 0.1 °C. Residuals are shown below the graph. B, far-UV CD spectra of the RbAB domain before thermal denaturation at 20 °C (full line), at the end point of the scan at 80 °C (broken line), and after decreasing temperature to 20 °C following denaturation (dotted line). mdeg, millidegrees.

