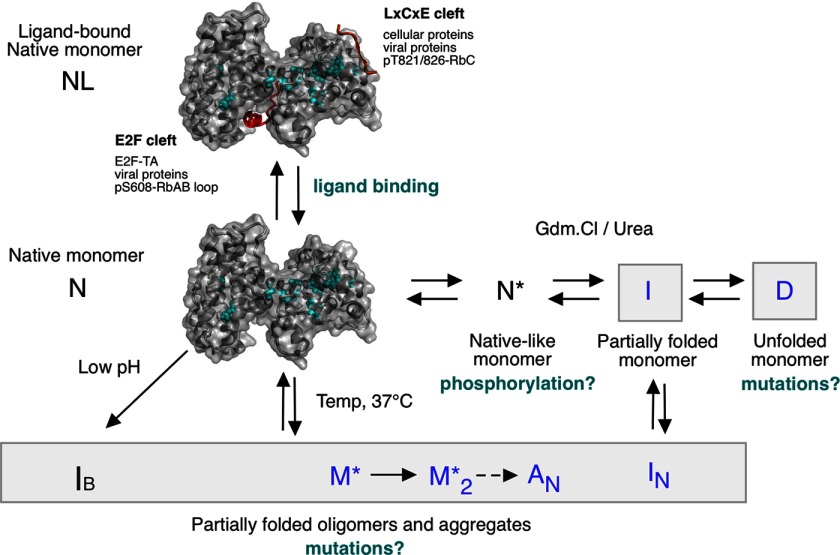
FIGURE 9.
RbAB conformational equilibria and possible effects of ligand binding, mutation, or phosphorylation. The diagram represents the native and non-native species populated by the RbAB domain. The RbAB ligand-bound form is derived from Protein Data Bank codes 1GUX and 1N4M with the LXCXE peptide in orange and the E2F-TD peptide in red. Tumorigenic mutations located in the RbAB hydrophobic core are mapped on the RbAB structure and shown as cyan spheres. Reversible processes are represented with double arrows, and irreversible processes are represented with one-way arrows with RbAB species where the B domain is unfolded marked in blue. Gray boxes indicate conformations that may be stabilized by tumorigenic mutations. Temp, temperature.

