FIGURE 2.
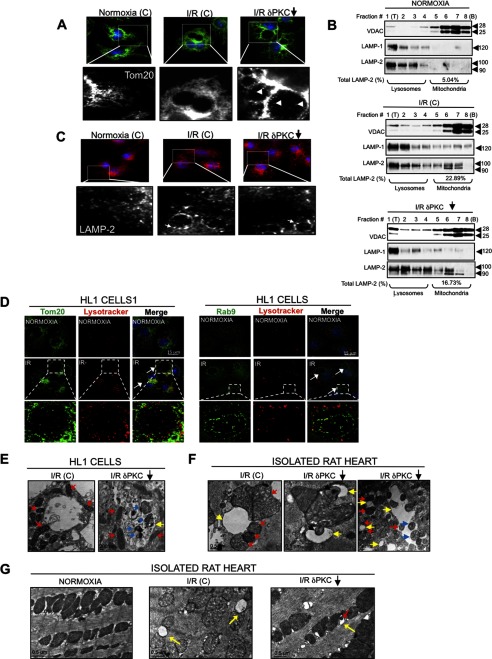
I/R-induced injury triggers the formation of LL structures. A, HL1 cells were treated with a control peptide (C) and the PKCδ translocation inhibitor peptide (δV1–1, indicated by a downward arrow) and subjected to normoxia (N) or I/R. The cells were fixed and analyzed by immunofluorescence (×100 magnification) using an antibody for the mitochondrial marker, Tom20 (green channel). An indicated portion of each image is expanded to illustrate the uptake of mitochondria (Tom20+, white arrowheads) into the large vacuolated structures in the presence of δV1–1 (white arrowheads). B, HL1 cells subjected to normoxia or I/R with a control peptide (C), or I/R with δV1–1 were fractionated on density gradients. Fractions were collected from the top (T) to the bottom (B) of each gradient. Organelles were pelleted and analyzed by Western blotting for the presence of lysosomes, mitochondria, and late endosomes using anti-LAMP-1, anti-VDAC, and anti-LAMP-2 antibodies, respectively. LAMP-2 levels in the mitochondrion-enriched fractions (at the bottom of each gradient) are indicated as a percentage of LAMP-2 levels present in the entire gradient. C, HL1 cells subjected to normoxia or I/R with a control peptide (C), or I/R with δV1–1 were fixed and analyzed by immunofluorescence microscopy using anti-LAMP-2 antibody (×100 magnification). White arrows indicate LAMP-2+ late endosome structures. D, HL1 cells subjected to normoxia or I/R were labeled with LysoTracker Red, fixed, and analyzed by immunofluorescence with a deconvolution microscope using anti-Tom20 or anti-Rab9 to visualize mitochondria and late endosomal membranes, respectively. Images were acquired at ×100 magnification and represent maximum intensity projection of image stacks. White arrows indicate LL structures. The boxed portion in each I/R group is expanded, showing representative LL structures. E and F, TEM analysis of intact HL1 cells (E) or isolated rat hearts (F) following I/R-induced injury in the absence or presence of the PKCδ translocation inhibitor, δV1–1. Yellow arrows indicate the LL structures, red arrows indicate the peri-LL-associated mitochondria, and blue arrows the internalized mitochondria. G, TEM images of normoxic control rat hearts (left panel) or hearts subjected to 30 min of ischemia followed by 30 min of reperfusion in the presence of a control peptide (middle panel) or δV1–1 (right panel). Direct engulfment of mitochondrial material into a vacuolated structure is shown in the right panel. Yellow arrows indicate the I/R-induced appearance of vacuolated structures, in the vicinity of mitochondria following I/R injury. Red arrows indicate segregated portions of mitochondria engulfed by vacuolated structures.

