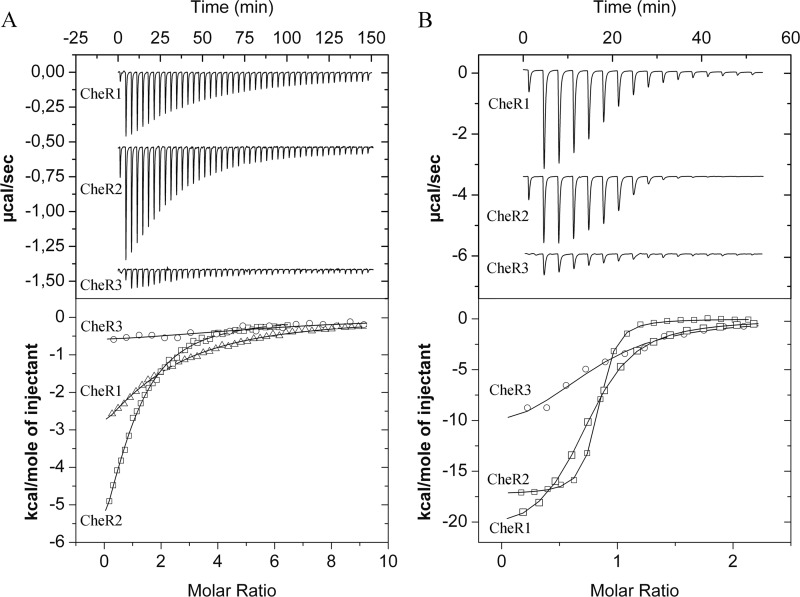
FIGURE 4.
Microcalorimetric titrations of the three CheR paralogues with of SAM and SAH. A, titration of the three CheR proteins with SAM is shown. B, titration of the three CheR paralogues with SAH is shown. The upper panels show titration raw data. The protein concentration used was between 16 and 28 μm, and the ligand concentration was either 0.5 or 1 mm. A titration consisted of an initial injection of 1.6 μl followed by a series of 3.2- or 6.4-μl injections. For reasons of clarity, data have been offset on the y axis. Lower panel, shown are integrated, dilution-corrected, and concentration-normalized titration raw data, which were fitted using the one binding site model of the ORIGIN version from MicroCal.

