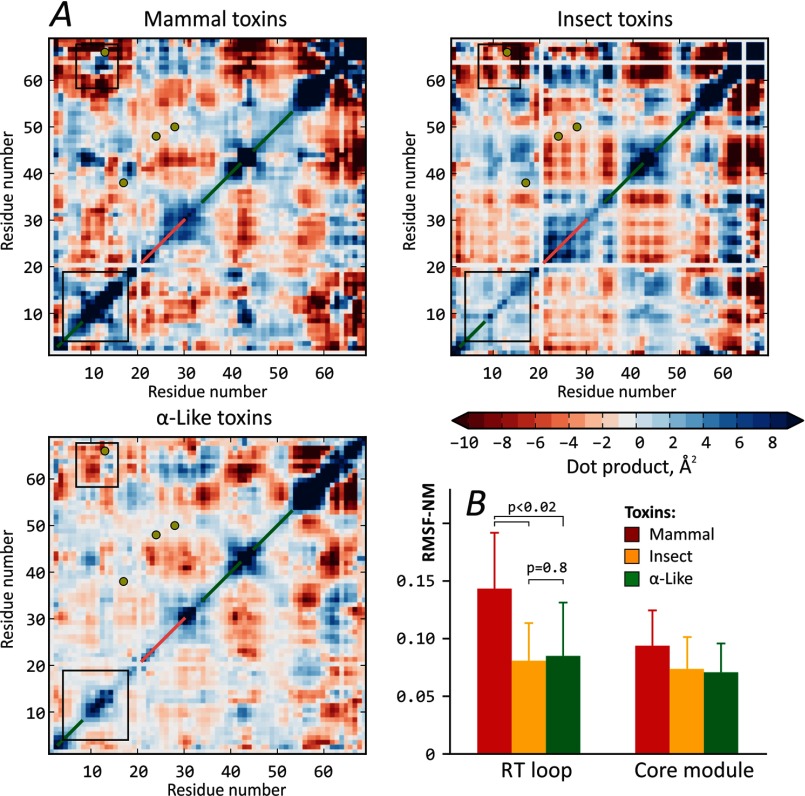
FIGURE 3.
Analysis of essential dynamics in scorpion α-toxins. A, most similar modes in collective motions of scorpion α-toxins. Each of the three maps shows high amplitude correlated motions, characteristic of the corresponding toxin group. Disulfide bridge positions are shown with yellow circles; β-strands and α-helices are marked with green and pink diagonal lines, respectively. Black boxes highlight areas of the most prominent difference between the groups. The scale is the dot product of two vectors, describing the motion of each residue in the first eigenvector-related dynamics. Note that maps are symmetrical with respect to the diagonal. White strips in the maps correspond to gaps in the alignment, presented in Fig. 1. B, mammal toxins feature the most flexible RT loops. Group-averaged mean RMSF-NM values for residues in the RT loop and core modules are plotted. p values are given to emphasize the significance of difference between groups of mammal and insect toxins. Error bars, S.D.

