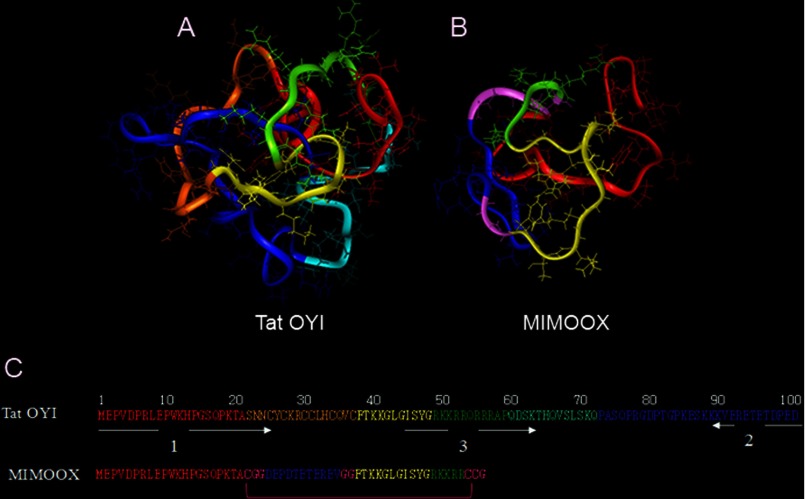
FIGURE 1.
Tat OYI and MIMOOX molecular modeling. Tat OYI (A, C) is divided into six regions: region I (residues 1–21) is depicted in red, region II (cysteine-rich region, residues 22–37) in orange, region III (residues 38–48) in yellow, region IV (basic region, residues 49–59) in green, region V (residues 60–72) in light blue, region VI (residues 73–101) in blue. MIMOOX (B and C) comprises the N-terminal region (red), followed by the inverted sequence of the C terminus (blue) and then region III (yellow), and a part of the arginine-rich region (green). Glycines serve as a linker between the three Tat regions are in purple. Two of the three cysteines create a disulfide bridge that is essential to have a three-dimensional epitope in the MIMO equivalent to the three-dimensional epitope in Tat OYI.

