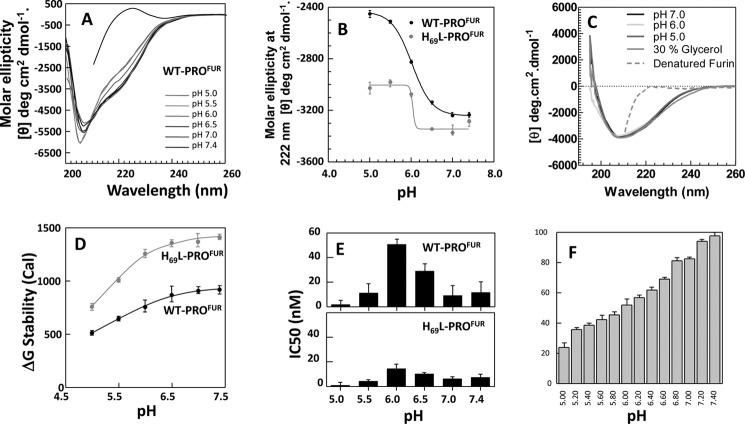
FIGURE 3.
H69L-PROFUR is more stable than WT-PROFUR to pH-induced unfolding. A, pH-dependent secondary structure of WT-PROFUR performed at pH 7.0–5.0 and plotted as molar ellipticity. B, changes in secondary structure of the isolated propeptides monitored by changes in ellipticity at λ = 222 nm and plotted as a function of increasing pH. The midpoint of the unfolding transition for both peptides occurs at pH ∼6.0. C, CD structure of MATFUR at varying pH (colored lines) and with the addition of 30% glycerol (gray line). The dotted line represents the spectra of denatured MATFUR. D, thermodynamic stability of WT-PROFUR and H69L-PROFUR as a function of pH, given in calories (Cal). E, IC50 values for WT-PROFUR (top panel) and H69L-PROFUR (bottom panel) as a function of pH. F, activity of furin in the absence of the propeptide at varying pH. All values are given as a percentage of maximum activity and are the average of three independent experiments.

