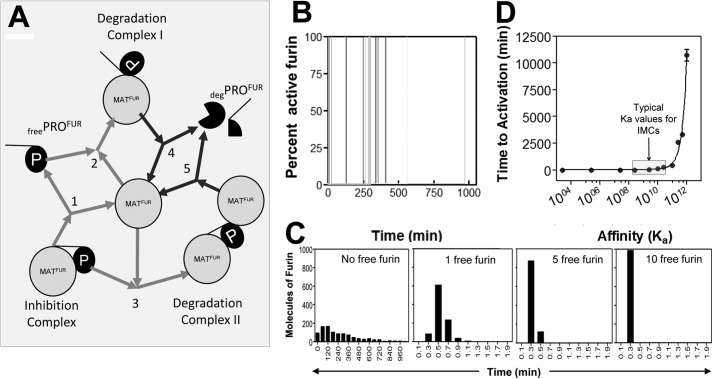
FIGURE 4.
Mathematical modeling of furin activation. A, model of the furin activation pathway used in mathematical simulations. Fur = furin (protease), p = propeptide. Rates for each step were modeled in accordance with published values in the literature. The gray and black arrows depict reversible and irreversible reactions, respectively. B, stochastic activation of furin over 15 sample simulations. C, distribution of stochastic activation times (min) of furin over 1000 sample iterations (first panel, no free furin) and distribution of activation times (min) when active furin is present (second, third, and fourth panels). D, change in time to activation (min) as Ka, the affinity of furin for free PROFUR, is altered. The gray box indicates the physiologic range of Ka values for IMCs (intramolecular chaperones). E, the change in time to activation (min) as kcat, the catalytic efficiency, or the rate of dissociation of deg-PROFUR from degradation complexes I and II to release active furin, is altered.

