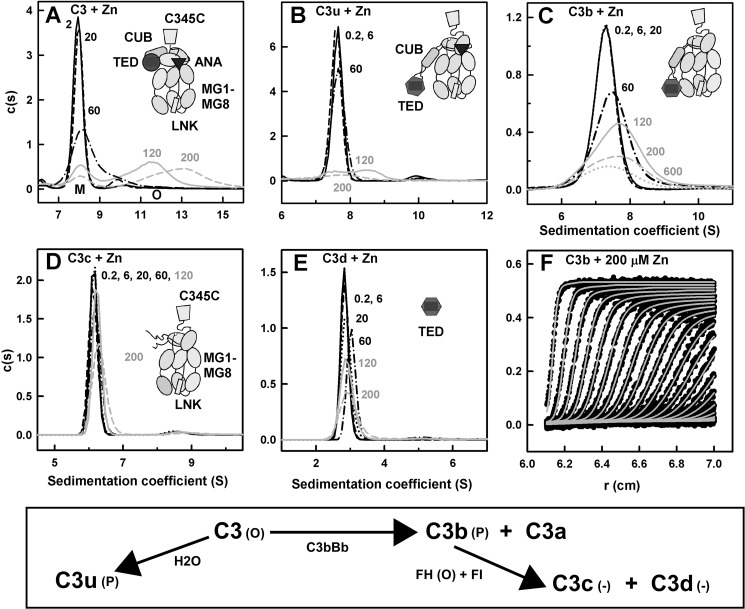
FIGURE 1.
Sedimentation velocity analyses of C3, C3u, C3b, C3c, and C3d in the presence of zinc. C3, C3u, C3b, and C3c were studied at 4.4 μm, and C3d was studied at 7.8 μm. The 10–13 domains of C3, C3u, C3b, and C3c are depicted as schematics with the TED (circle or hexagon) and ANA (triangle) domains shown in dark outlines when present. Beneath the c(s) plots, a schematic summary of the relationships between the five forms of C3 is shown. Oligomers, precipitates, or no changes upon adding zinc are denoted by P, O, and −, respectively. A, the c(s) sedimentation coefficient distribution analysis for C3 with zinc concentrations at 2 μm (solid black line), 20 μm (black dashes), 60 μm (black dots and dashes), 120 μm (solid gray line), and 200 μm (gray dashes). The monomer peak is denoted as M, and the oligomer peaks at high S values are denoted as O. Here and below, the zinc concentrations in μm are denoted numerically. B, the c(s) analysis for C3u with zinc concentrations at 0.2 μm (line) and 6 μm (dashes) and three higher zinc concentrations are shown as in A. C, the c(s) analysis for C3b, with zinc concentrations at 0.2 μm (line), 6 μm (dashes), and 20 μm (dots), and three higher zinc concentrations are shown as in A. D, the c(s) analysis for C3c with zinc concentrations are shown as in C. E, the c(s) analysis for C3d with zinc concentrations are shown as in C. F, shown are the sedimentation boundary fits for C3b with 200 μm zinc; all 30 scans are shown. The experimental absorbance data are shown as black circles, whereas the boundary fits are shown as gray lines.

