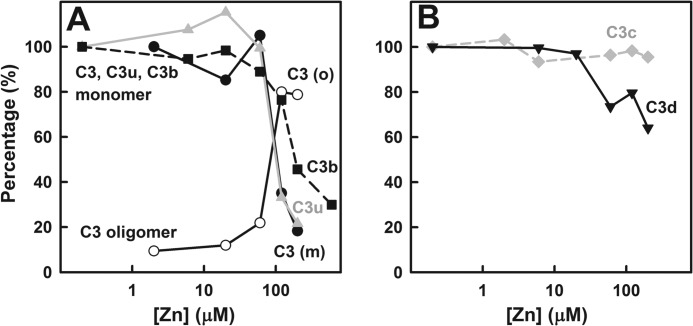
FIGURE 2.
The percentages of the monomers and oligomers of the five C3 proteins as a function of zinc concentrations. These were determined from the c(s) analyses of Fig. 1. A, C3 (filled circle, monomer; open circle, oligomer, black line); C3u (gray triangle, monomer; gray line); C3b (filled square, monomer, black dashes). B, C3c (gray diamond, monomer; gray dashes); C3d (black inverted triangle, monomer, black line).

