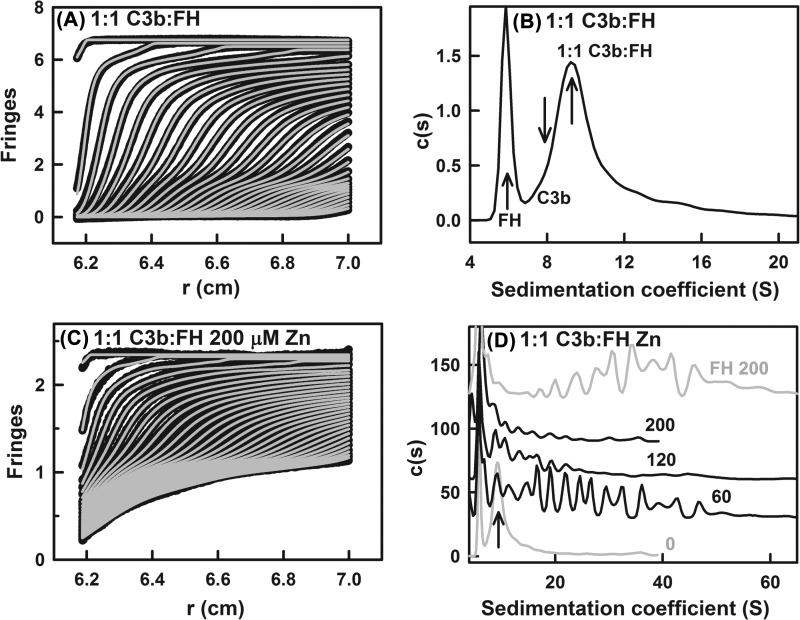
FIGURE 3.
Sedimentation velocity analyses of the C3b-FH complex in the presence of zinc. A, shown are the boundary fits for the 1:1 mixture of 5.5 μm C3b and 5.5 μm FH. Only every tenth scan of the 300 scans is shown for clarity. The absorbance data are shown as black circles, whereas boundary fits are shown as gray lines. B, shown is the c(s) sedimentation coefficient distribution analysis for the 1:1 mixture of C3b and FH. The peak positions for the FH monomer (5.77 S), C3b monomer (8.16 S), and the 1:1 C3b-FH complex (9.55 S) are arrowed. C, the boundary fits for the 1:1 mixture of 5.5 μm FH-C3b and 5.5 μm FH with 200 μm zinc following the representation of A. D, the c(s) analyses for the 1:1 mixture of FH:C3b with 60 μm, 120 μm, and 200 μm zinc (black outlines) are shown. The analyses are normalized relative to the FH monomer peak. The zinc concentrations are denoted numerically. The peak position of the 1:1 FH-C3b complex is shown with an arrow. For comparison, the two c(s) curves (gray outlines) for the complex from B with no zinc present and for FH alone with 200 μm zinc from Fig. 4D of (31) are shown to the same scale.

