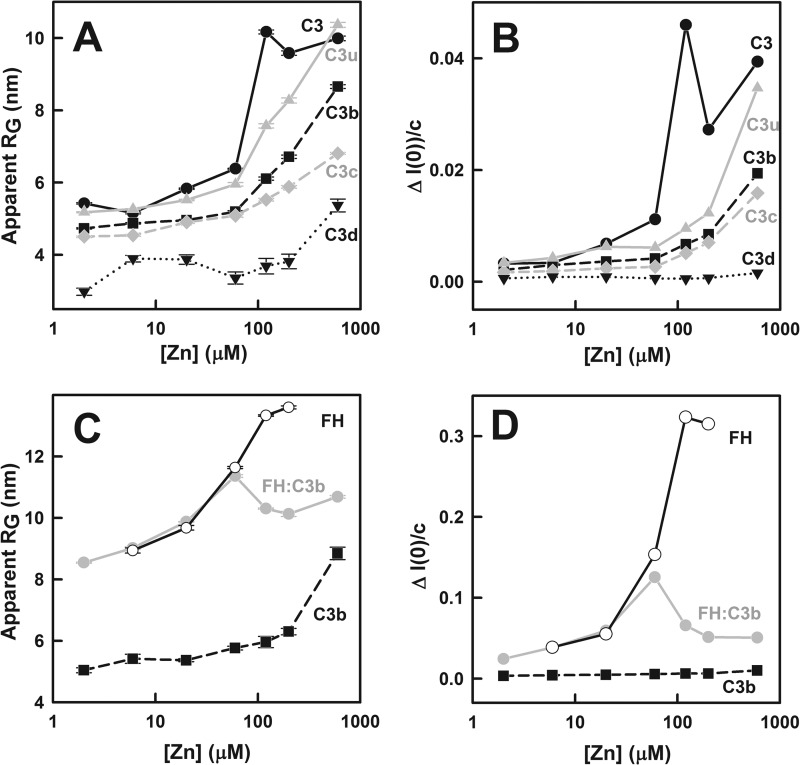
FIGURE 5.
Dependence of the Guinier RG and I(0)/c parameters on zinc concentrations from 2 to 600 μm. Each value was measured in quadruplicate and averaged, and statistical error bars are shown where visible. A, the apparent RG values for C3 (black circles, black line), C3u (gray triangles, gray line), C3b (black squares, black dashes), C3c (gray diamonds, gray dashes) and C3d (inverted black triangles, dotted line) were determined from the fits of Fig. 4, A–E. B, shown is the change in the I(0)/c values between the Guinier plots, the difference based on the Q fit ranges of 0.14–0.22 and 0.32–0.45 nm−1 for C3, C3u, C3b, C3c, and C3d using the same symbols as in A. C, the apparent RG values for FH (open circles, black line), the FH-C3b complex (gray circles, gray line), and C3b (black squares, dashed line) measured in another beam session are compared with each other (the Guinier fits are not shown). D, shown is the change in the I(0)/c values between the Guinier plots, the difference based on the Q fit ranges of 0.14–0.22 and 0.32–0.45 nm−1 for FH, the C3b-FH complex, and C3b, using the same symbols as in C.

