
FIGURE 3.
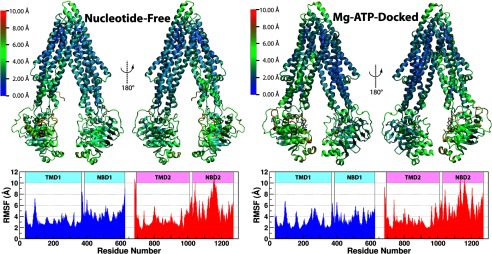
The r.m.s.f. of Cα atoms of Pgp under each of the two simulating conditions. r.m.s.f. was calculated for all four systems combined and shown as a heat map over a representative structure. The r.m.s.f. results are not significantly altered after excluding the first 10 ns of trajectories of each system (see supplemental Fig. S7b).