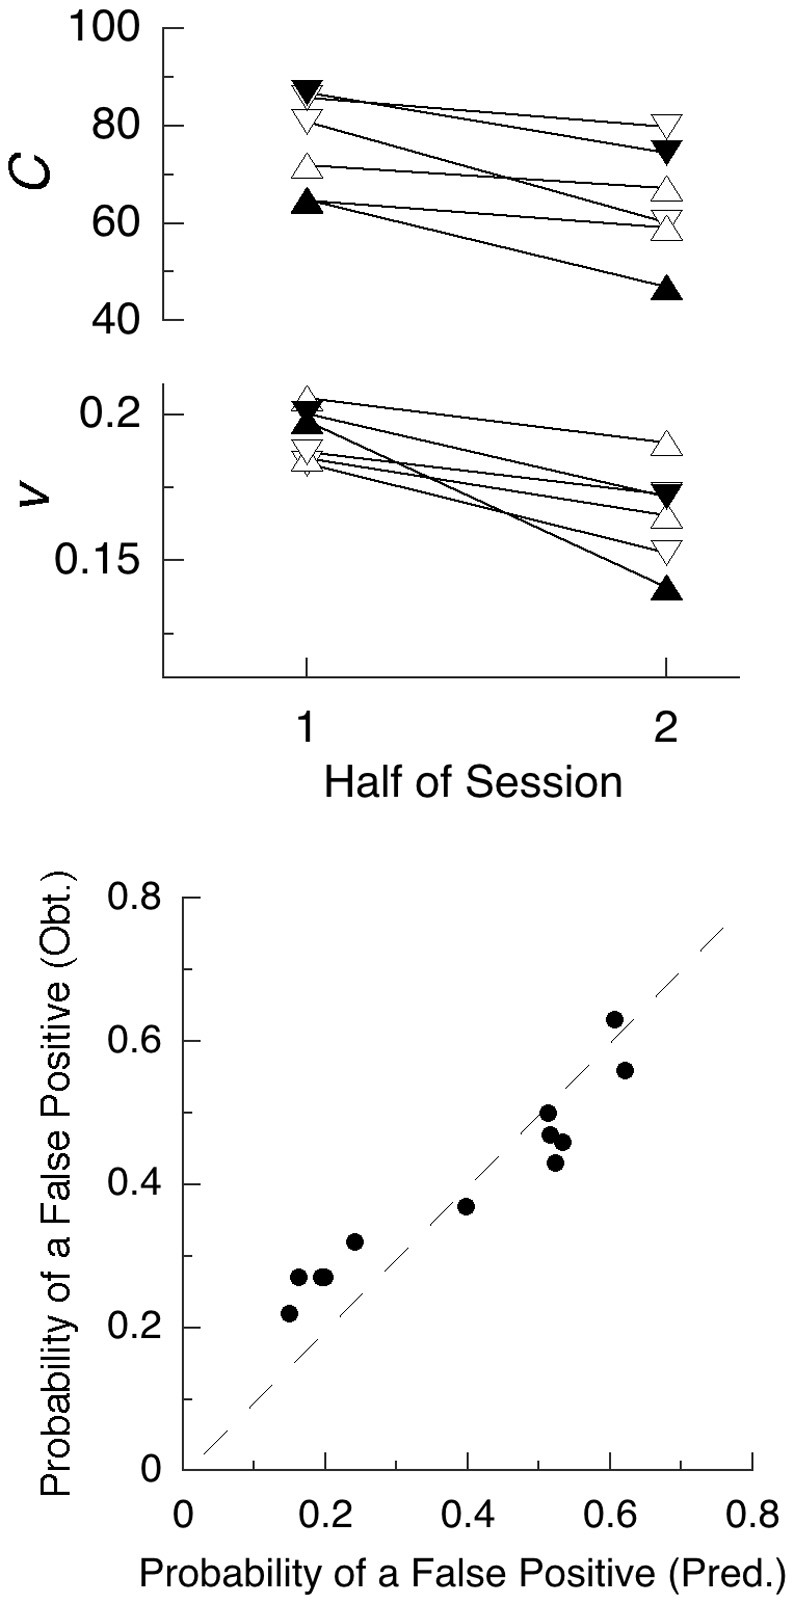
Figure 2.

Top Panel: Summary statistics from two experiments using the SART (Seli et al., 2012a) entail these values for criterion (C) and speed of computation (v). Fatigue of functional units, here involving the brain circuits used for discrimination of the symbol “3”, is manifest by lower values of v in the second half of all experiments. The triangles denote standard instructions, and the inverted triangles “go-slow” instructions. Filled symbols are from the conditions with distracting audio alerts. Bottom panel: Assuming a value of Tstop = 343 ms predicts the probability of failing to abort a response on the no-go trials, as shown on the x-axis; the y-axis gives the obtained probabilities.
