Figure 12.

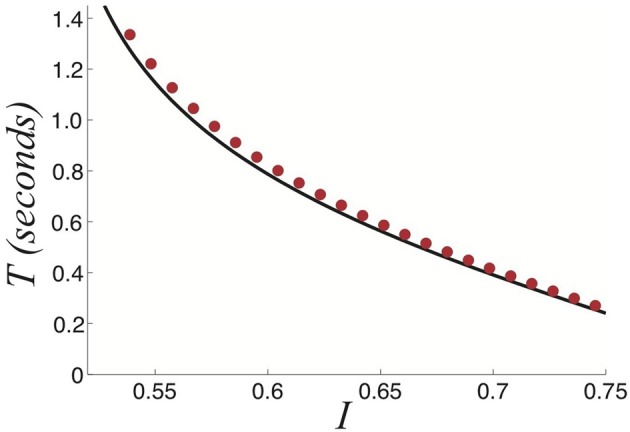
Relationship between the strength of the stimulus I and the dominance times T computed using fast-slow analysis (black) and numerics (red dots) for a perceptually tristable stimulus. Other parameters are β = 1 and τ = 50.

Relationship between the strength of the stimulus I and the dominance times T computed using fast-slow analysis (black) and numerics (red dots) for a perceptually tristable stimulus. Other parameters are β = 1 and τ = 50.