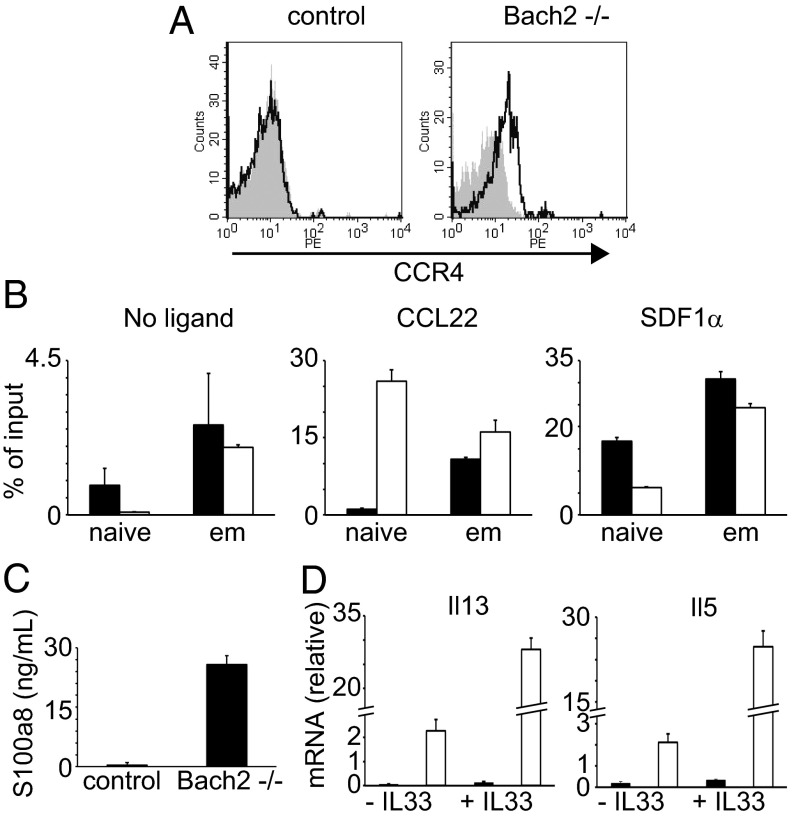
Fig. 4.
Functional characteristics of Bach2−/− T cells. (A) The expression of CCR4 on naive CD4 T cells. The solid and filled gray lines illustrate the staining with anti-CCR4 and a control mAb, respectively. (B) Migration assay in vitro. Total splenocytes were used for a transwell assay with CCL22 (CCR4 ligand), SDF1α (unrelated ligand), or no ligand. After incubation, cells were stained with anti-CD4, CD62L, and CD44 mAbs. The number of migrating cells was determined by flow cytometry and expressed as % of the input cell numbers. The filled and open bars indicate control and Bach2−/− cells, respectively. (C) Serum levels of S100a protein. The serum S100a level from WT and Bach2−/− mice was analyzed by ELISA. (D) ST-2 function in Bach2−/− naive CD4 T cells. WT or Bach2−/− naive CD4 T cells were stimulated with anti-CD3 and CD28 Abs with or without IL33 for 1 d. The mRNA expression of Il13 and Il5 cytokines was assessed by qPCR The filled and open bars indicate Bach2+/+ and Bach2−/− cells, respectively. Data are expressed as mean ± SD, n = 3.

