
Fig. 2.
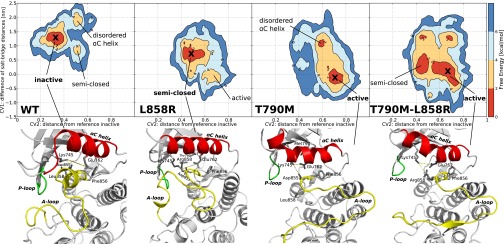
Free energy surface of wild-type EGFR and the three mutants as a function of CV1 (y axis) in nm and CV2 (x axis) in arbitrary units. A cross indicates the global free energy minimum for which a representative structure is shown below. Each minimum is also named according to the corresponding main feature. The contour lines are drawn every 2 kcal/mol. In the structures below the free energy surfaces the αC-helix is shown in red, the A-loop in yellow and the P-loop in green. The distances between K745:E762 and K745:D855, whose difference constitute CV1, are displayed with a dashed yellow line.