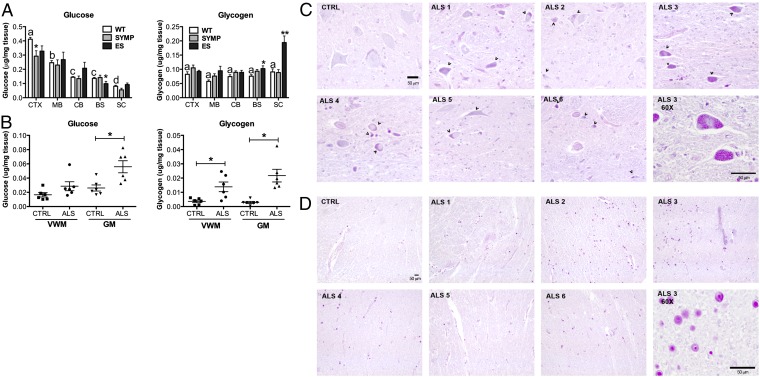
Fig. 3.
Tissue levels of glucose and glycogen are affected by ALS disease course in mice and humans. (A) Glucose and glycogen levels as a function of CNS region (CTX, cerebral cortex; MB, midbrain; CB, cerebellum; BS, brainstem; and SC, lumbar spinal cord) in ALS mice as function of disease (SYMP, symptomatic stage; and ES, end stage vs. WT littermate controls. Significantly different from WT (*P < 0.05, **P < 0.0001). Bars with different letter are significantly different from each other (P < 0.0001). (B) Glucose and glycogen levels in human ALS and control (CTRL) cervical spinal cord tissue homogenates (GM, gray matter; VWM, ventral white matter). Significantly different from CTRL (*P < 0.001). Error bars represent ±SEM. (C and D) Paraffin-embedded, PAS-stained cervical spinal sections of human ALS and CTRL donors (C, GM; D, VWM; arrowheads point to glycogen storage; all images are at 20× cells except for panels at 60× in the Lower Right corner in C and D. (Scale bars, 50 μm.)

