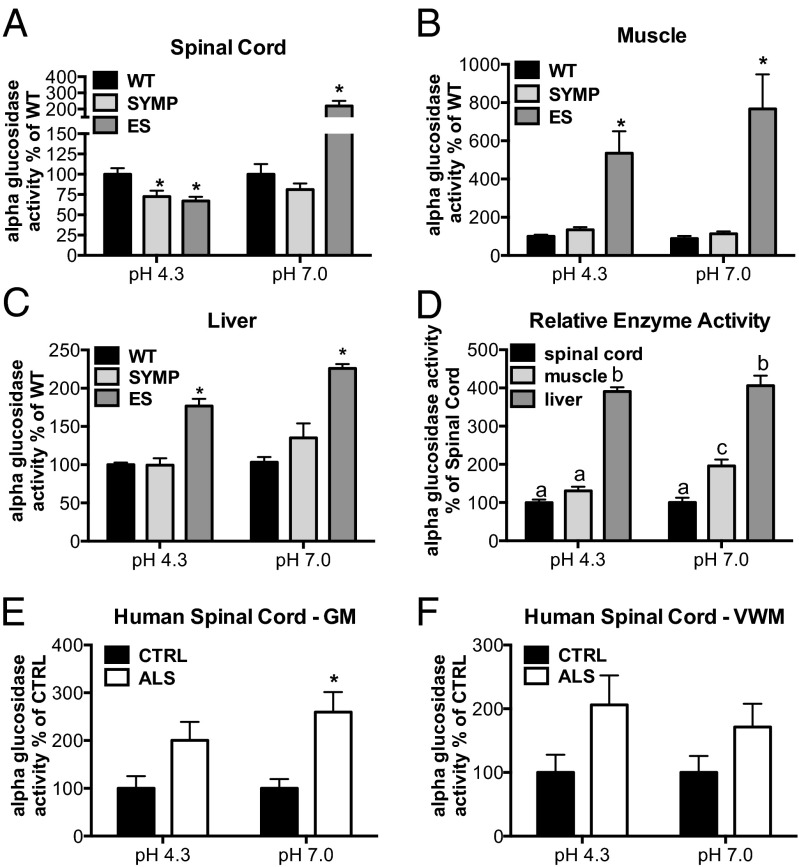
Fig. 5.
α-Glucosidase activity is affected by ALS disease course in mice and patients. Lysosomal (pH 4.3) and neutral (pH 7.0) α-glucosidase activities were measured in ALS mice as a function of disease phase vs. WT littermate controls (SYMP, symptomatic; ES, end stage) in (A) spinal cord, (B) muscle, and (C) liver. Significantly different from WT (*P < 0.001). (D) Relative enzyme activity across different tissues (in WT mice) graphed relative to spinal cord levels. Bars with different letters are significantly different from each other (P < 0.01). (E and F) Lysosomal (acidic) and neutral α-glucosidase activities in human ALS and control (CTRL) cervical spinal cord tissue homogenates (GM, gray matter; VWM, ventral white matter). Significantly different from CTRL (*P < 0.01). Error bars represent ±SEM.

