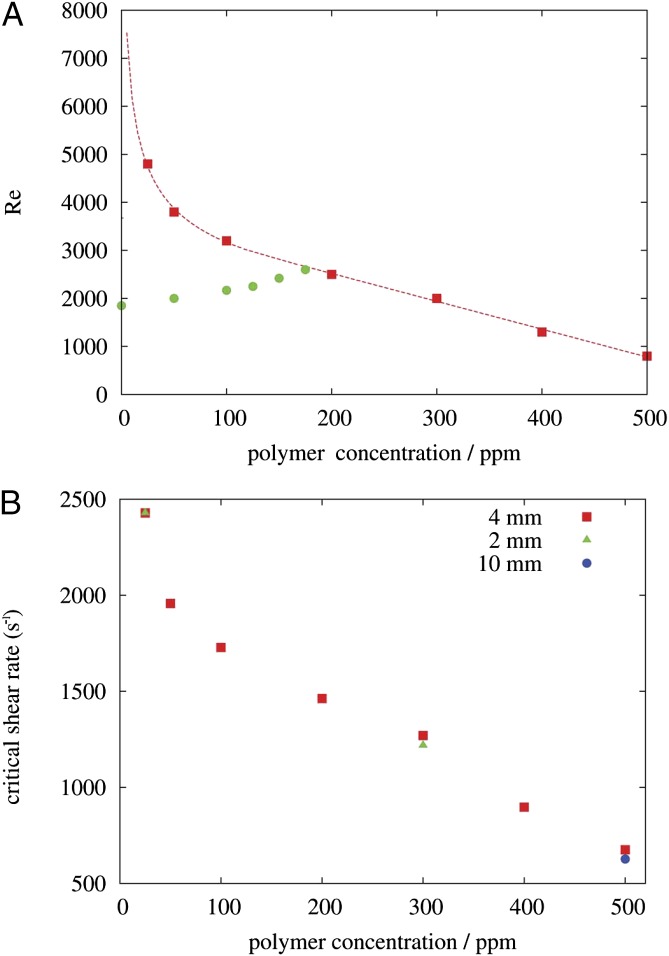
Fig. 3.
Transition threshold to EIT is plotted for different concentrations (red squares). The red line is a guide for the eye. The green circles mark the transition delay to ordinary turbulence (Fig. 1B). Consequently, for concentrations below 200 ppm, the elasto-inertial instability sets in at a  at which ordinary turbulence can already occur, whereas in the
  -mm pipe, the elasto-inertial instability is found only above 200 ppm. (B) Red squares mark the critical shear rate for the onset of EIT in the 4-mm pipe (same as red squares in A). In addition, shear rates (
 ) were determined for the flow in a
  -mm pipe and a
  -mm pipe. In these cases, the transition occurs at the same critical shear rate. Hence, unlike ordinary turbulence, the onset of EIT is not governed by the
  but, instead, by the shear rate.

