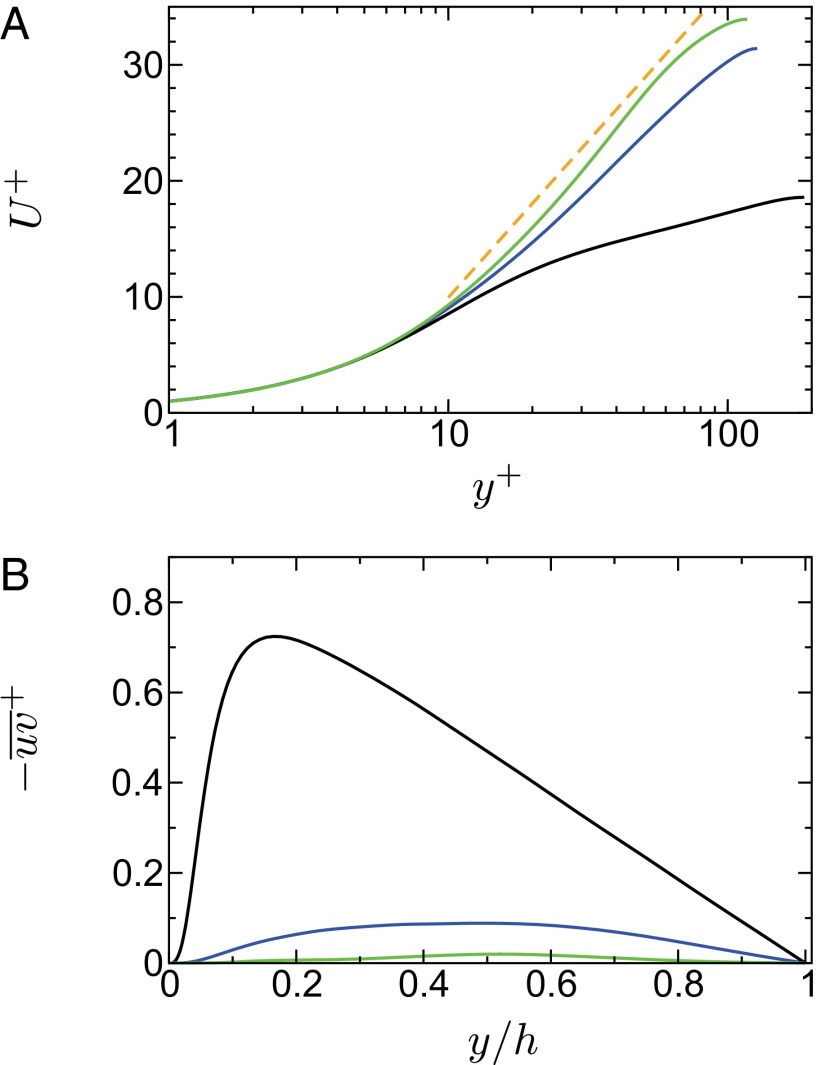
Fig. 5.
Profiles of turbulence statistics at the highest simulated  with the addition of a higher
  simulation. For FENE-P fluids (see SI Text),
  leads to a universal form of the polymer tensor closely related to the MDR asymptotic state. Mean velocity profiles in the typical log-linear representation are shown, where the mean velocity
  and the distance from the wall
  are normalized by skin-friction velocity
  and kinematic viscosity (A) vs. profiles of Reynolds shear stress,
  , as a function of the distance from the wall normalized by the channel half-height h (B). Statistics are shown for Re = 6,000; solid blue line, Wi = 100; solid green line, Wi = 700; solid black line, Newtonian turbulent flow. (A) Virk log-law (6) is denoted by the dashed orange line. The Virk mean velocity profile is a best fit of high
  data. The assumption of the existence log-law at a low
  was recently shown (39) to fail at a low to moderate
  (at least up to
  ). The agreement of
  is consistent with previous MDR simulations and experiments. (B) Experiments of Warholic et al. (41) at MDR observe negligible Reynolds shear stress.

