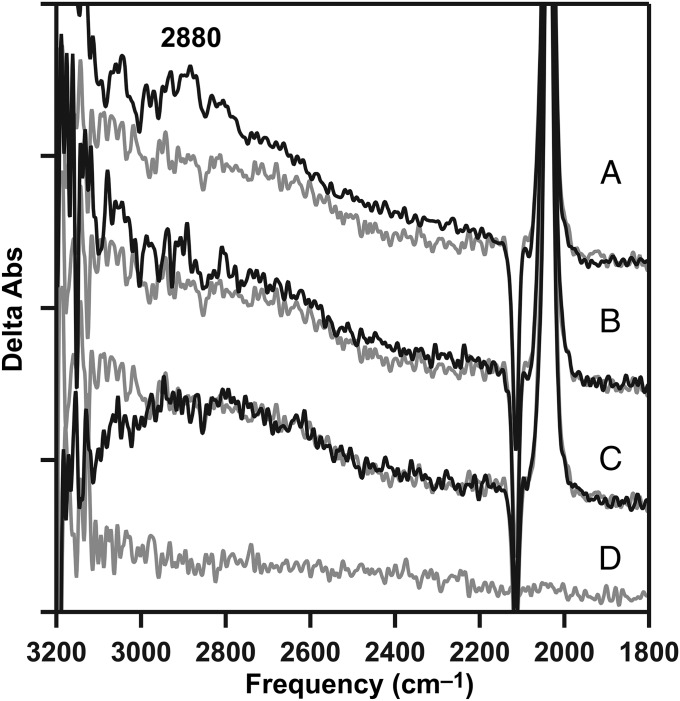
Fig. 6.
Inability of strontium or magnesium to support the formation of a 2,880-cm−1 band from the protonated water cluster, W5+. (A) Positive 2,880-cm−1 cationic water cluster band in the calcium S2-minus-S1 difference spectrum (black), compared with calcium-depleted (gray; repeated from Fig. 2A, gray). (B) Strontium S2-minus-S1 spectrum (black), compared with calcium-depleted (gray; repeated from A, gray). (C) S2′-minus-S1 spectrum after treatment with magnesium (black), compared with calcium-depleted (gray; repeated from A, gray). The calcium-depleted difference spectrum was acquired with a single flash to a dark-adapted sample and corresponds to S2′-minus-S1. (D) Baseline (S1-minus-S1) acquired from a dark-adapted strontium PSII sample. Spectra are averages of 31 (A, black), 16 (B, black), 17 (C, black), 16 (D, gray), and 15 (A–C, gray) samples. y axis ticks represent 1 × 10⁻⁴ absorbance units. The temperature was 263 K.

