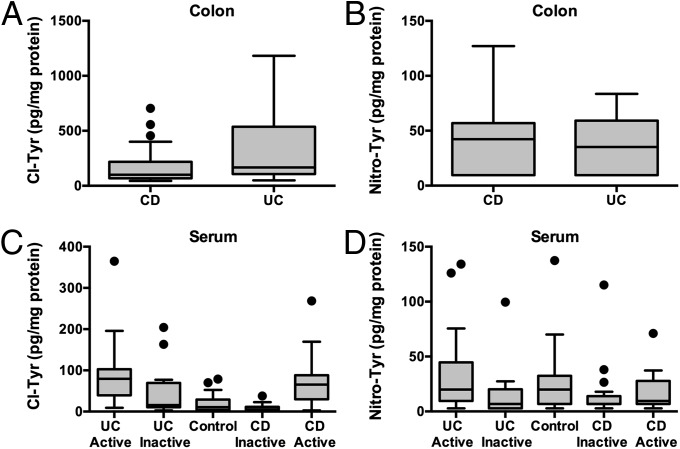
Fig. 2.
Cl-Tyr and Nitro-Tyr were quantified in human tissues using stable isotope dilution LC-MS/MS analysis. (A and B) Quantitation of Cl-Tyr and Nitro-Tyr in IBD colon tissue (UC, n = 18; CD, n = 22). (C and D) Quantitation of Cl-Tyr and Nitro-Tyr in IBD and non-IBD serum (Control, n = 29; UC active, n = 38; UC inactive = 19; CD active, n = 42; CD inactive, n = 20). Cl-Tyr levels in both active UC (P value < 0.0001) and active CD (P value < 0.0001) serum samples were significantly higher than those observed in non-IBD control sera. Significant elevation in Cl-Tyr levels were also observed between UC active and UC inactive (P value = 0.0003), and CD active and CD inactive (P value < 0.0001) samples. A significant elevation was found in Nitro-Tyr levels between UC active and UC inactive (P value = 0.0038) samples. Statistical analysis for all panels is presented as box-and-whisker plots showing the median value (line), the interquartile range (box), and Tukey whiskers defining data within 1.5-fold of the interquartile range; all data outside the whiskers are presented as individual data points. Statistical significance between groups (two groups) was assessed by the Mann–Whitney U test.

