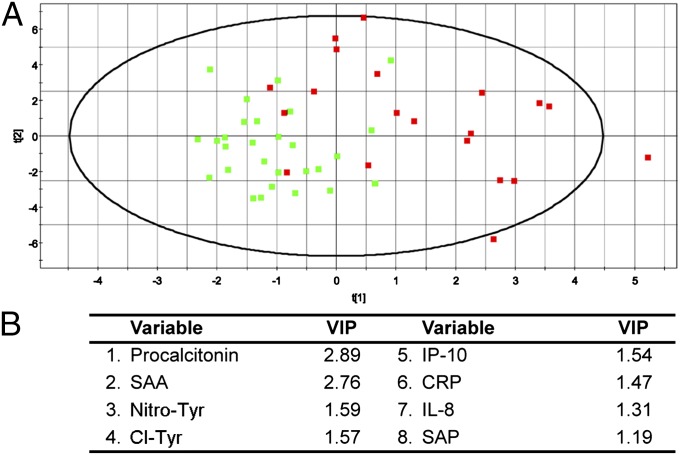
Fig. 7.
Multivariate modeling of CD serum analytes. Multivariate data analysis of serum analytes to identify discriminatory features between CD patients (red squares, n = 20) and non-IBD controls (green squares, n = 29). (A) A 2D projection of the partial least-squares multivariate analysis, which shows an overlapping distribution of CD patients and non-IBD controls. The model produced R2Y = 0.55 (model fit) and Q2(cum) = 0.15 (model prediction). (B) List of the top VIPs (VIP > 1.0) in the dataset that were most influential on the data separation.

