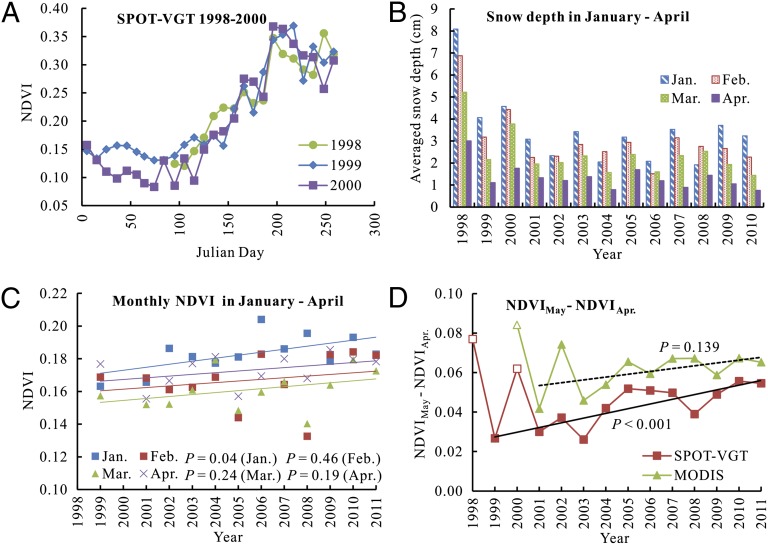
Fig. 1.
(A) SPOT-VGT NDVI dynamics in 1998, 1999, and 2000 in the Tibetan Plateau. (B) The averaged snow depths on the plateau in January, February, March, and April from 1998 to 2010. The snow depth data were derived from passive microwave remote-sensing data (3). The years 1998 and 2000 were exceptional years with dramatic snow events, which led to lower NGS NDVIs in 1998 and 2000 in A. The lower NGS NDVIs in the two years didn’t negatively bias the spring phenology estimate. Actually, the spring phenology in 1998 was identified as earlier than other years, e.g., 1999 [figure 1 of Zhang et al. (2)]. That may be because the higher temperature in the spring of 1998 converted big snowpack into abundant soil moisture and promoted vegetation growth. (C) Variations in January, February, March, and April NDVIs from 1999 to 2011, excluding 2000. We did not include 1998 and 2000 due to the outliers. The fitted linear regression lines with different colors represent the trends of monthly NDVIs. NDVIs in February to April didn’t show significant increase in this period. (D) Dynamics of May and April NDVI difference (NDVIMay − NDVIApr) for SPOT-VGT and MODIS. The averaged NDVIs from all of the vegetated pixels with NDVI > 0.1 in growing season were used. The fitted linear regression lines represent the trends of NDVIMay − NDVIApr with the outliers (nonfilled data point) in 1998 and 2000 being removed.

