Fig. 2.
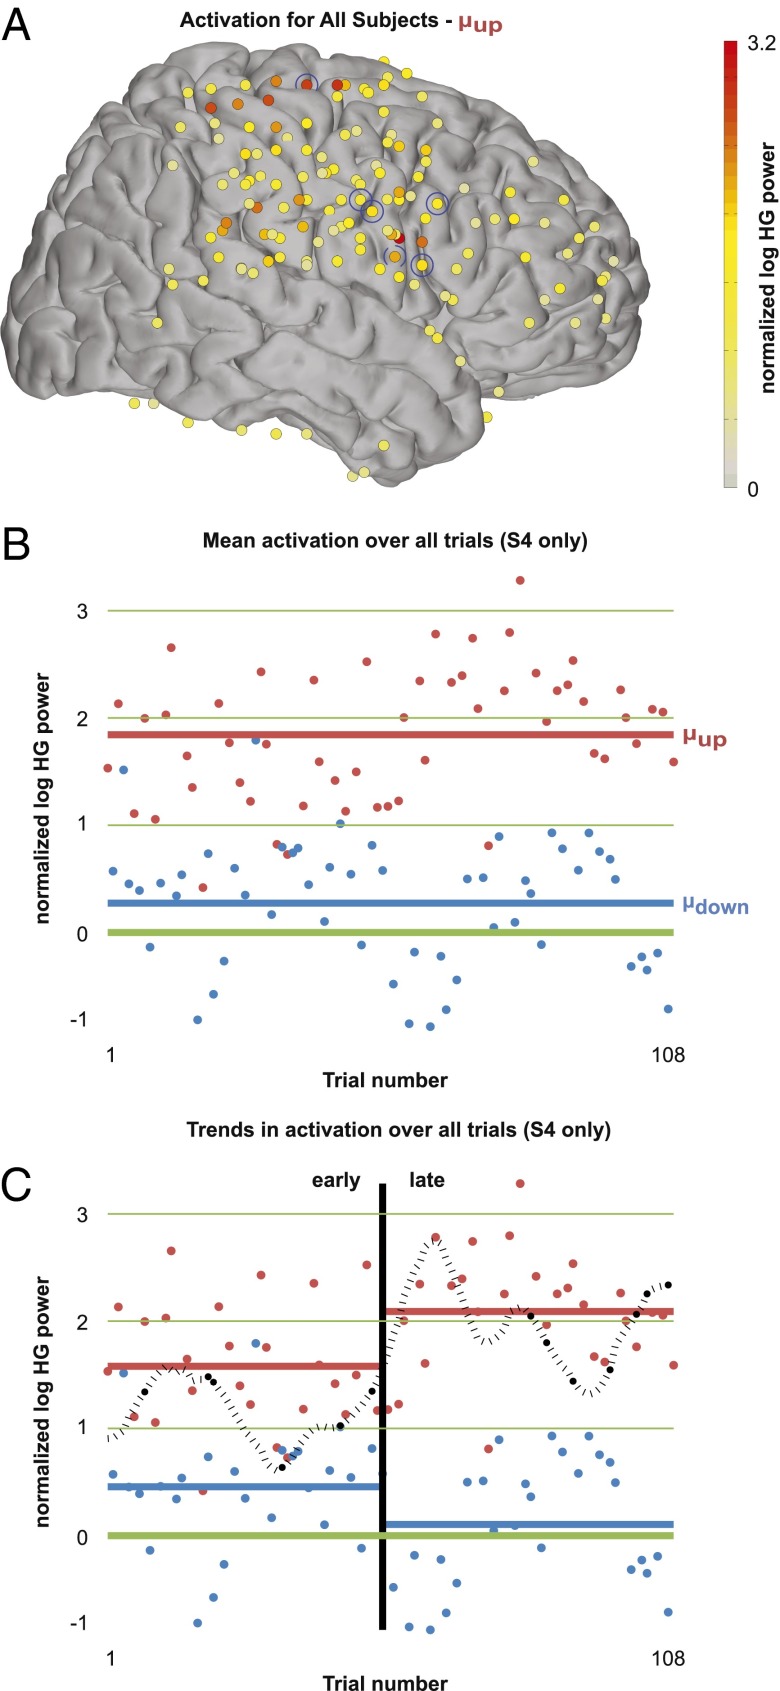
Cortexwide activity during BCI use and modeling of early vs. late activity patterns. (A) Activation during up targets for all lateral electrodes for all subjects (left coverage projected to right hemisphere) shown on the Talairach brain. Note widespread cortical activation including frontal, middle-parietal, and posterior-parietal areas. Controlling electrodes are circled in blue. (B) Activation for an example subject (S4) during each feedback period normalized against log HG power during rest. Each dot represents one trial; up and down targets are shown in red and blue, respectively. Thick red and blue lines represent mean activation for all trials, respectively. (C) Early-late trial division shown for subject S4. Separability of high-gamma activity during up and down trials was used as a measurement of task proficiency. A separabililty measure (black dotted line) was modeled as two Gaussian distributions and fit to the data such that the distance between the distributions was maximized.

