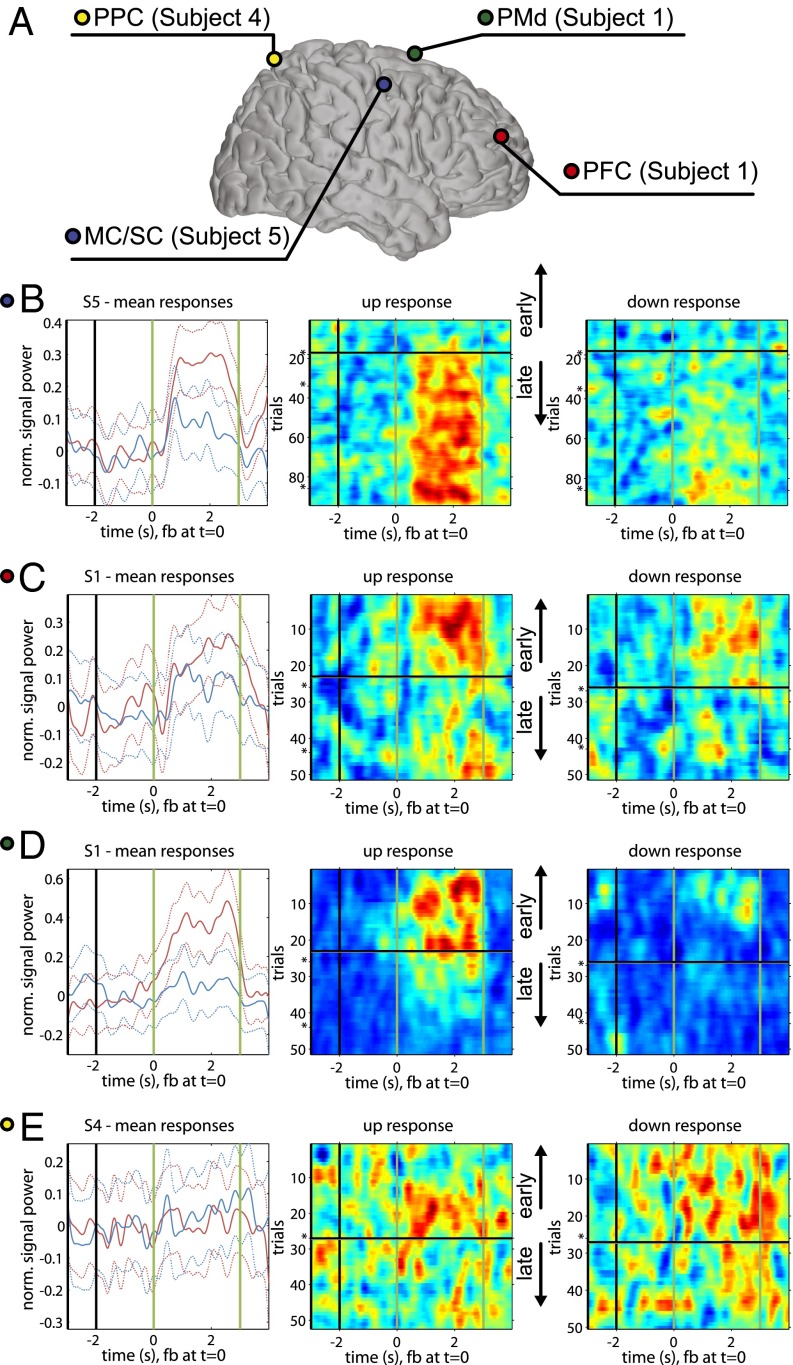
Fig. 3.
Time-by-trial high-gamma activation. (A) Distribution of electrodes shown in B–E on the Talairach brain. The subject from which each electrode was taken is noted; not all subjects had coverage in all areas (Fig. S2). (B–E) Subplot 1: average HG activation in a given electrode for all trials separated by up and down targets. Subject is specified in the subplot title. Phases of the task (ordered from L to R: inter-stimulus interval, target presentation, feedback, reward) are separated by vertical bars. Dotted line represents SEM. Subplots 2 and 3: trial-by-trial HG activation for all trials, separated by up (subplot 2) and down (subplot 3) targets. Trial count is shown on the vertical axis. Breaks in the experimental session of more than 8 h are denoted with an asterisk (*). Time, as described for subplot 1, is shown on the horizontal axis. The black horizontal bar represents the transition trial, and the early and late trials relative to this point are denoted with black arrows. (B) MC/SC electrode shows continued increase in activation for up targets, congruent with changes at the controlling electrode. (C) PFC electrode shows activation for both up and down targets, decreasing near the point of model separation. (D) PMd electrode shows activation for up targets, decreasing near the point of model separation. (E) PPC electrode shows subtle activation during up and down targets, decreasing near the point of model separation.

