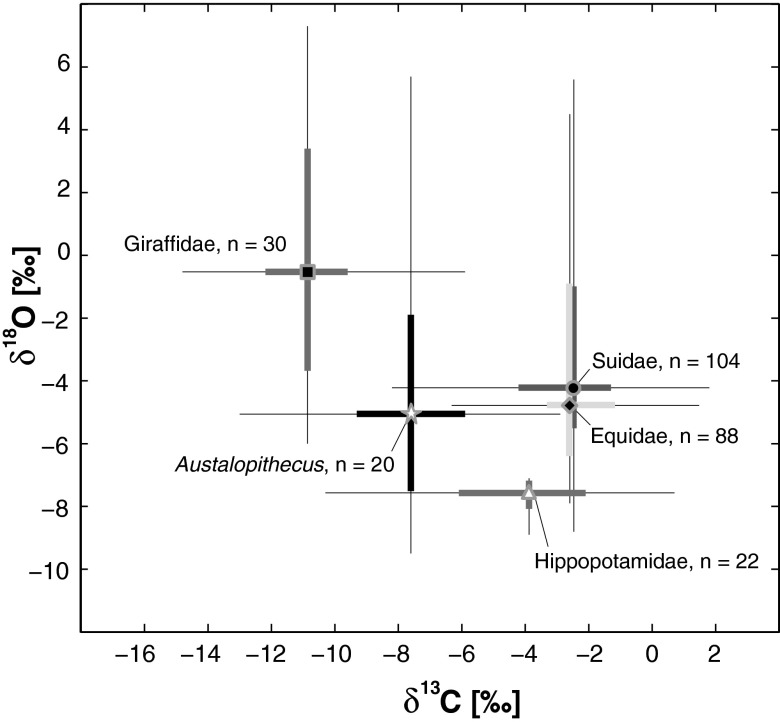
Fig. 4.
Cross-plot of box and whisker diagrams for carbon and oxygen isotopic composition (δ13C and δ18O values) of tooth enamel from Au. afarensis and select mammalian taxa from the Hadar Formation. Boxes represent 25th and 75th percentiles. Whiskers represent the range exclusive of outliers (defined in Fig. 1). Data are from this study (hominin samples are in SI Appendix, Table S1 and in ref. 44).

