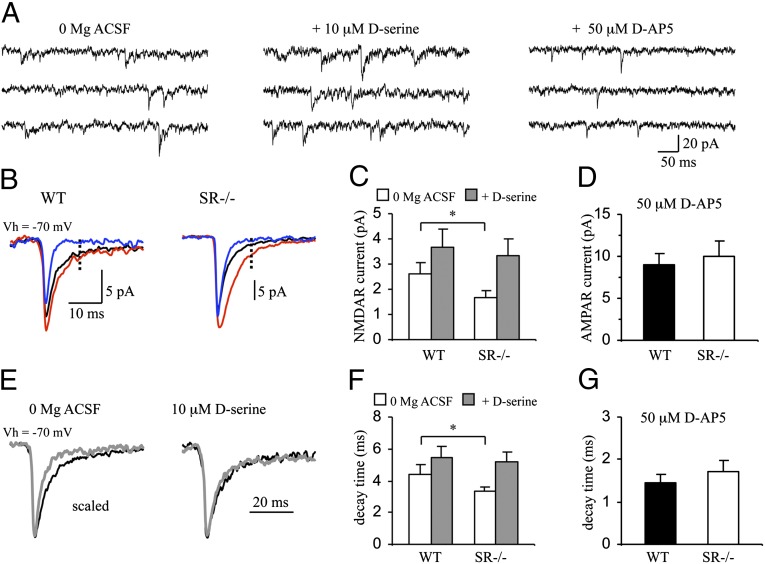
Fig. 1.
NMDAR mEPSCs in DG granule cells are smaller and faster in SR−/− mice. (A) Examples of mEPSCs recorded from a DG granule cell at −70 mV in the absence of Mg2+ (Left), in the presence of 10 μM d-serine (Center), and in the presence of 50 μM d-AP5 (Right). (B) Averaged mEPSCs (100–300 traces) recorded under control conditions (black), in the presence of d-serine (red), and in the presence of d-AP5 (blue) in slices from WT (Left) and SR−/− mice (Right). The amplitude of NMDAR mEPSCs were measured 10 ms after the peak (dashed line) of AMPAR currents in the presence of d-AP5. (C) Averaged amplitudes of NMDAR mEPSCs under different conditions. Data are from four WT (n = 6 cells) and four SR−/− (n = 10 cells) mice. (D) Averaged amplitudes of AMPAR mEPSCs in the presence of d-AP5 from three WT mice (n = 5 cells) and three SR−/− mice (n = 7 cells). (E) Superimposed averaged mEPSCs recorded from WT (black trace) and SR−/− mice (gray trace) under control conditions (Left) or in the presence of d-serine (Right). To ease the comparison of decay times, mEPSCs were scaled to the same peak amplitude. (F) Averaged decay times of mEPSCs. Data from four WT (n = 6 cells) and four SR−/− mice (n = 10 cells). (G) Averaged decay times of mEPSCs in the presence of d-AP5 from three WT (n = 5 cells) and three SR−/− (n = 7 cells) mice. Asterisk (*) indicates significant difference from the WT group (P < 0.05). All values represent the mean ± SEM.

