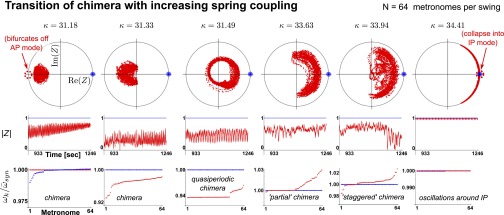
Fig. 4.

Traversal of order parameter cloud with increasing spring coupling κ. A transition through a rich spectrum of chimera states becomes evident. Numerical simulations are carried out with  metronomes (for parameters see SI Text). As κ increases, the complex order parameter
  bifurcates off from the AP mode at 180° and travels to the right, where it snaps into the IP synchronization mode at 0°. (Top) Complex order parameter Z is displayed. (Middle) Magnitude
  is displayed. (Bottom) Angular frequencies, normalized with the average frequency of the synchronized population
  , are displayed. The synchronized population is shown in blue, and the desynchronized population is shown in red.
