Fig. 3.
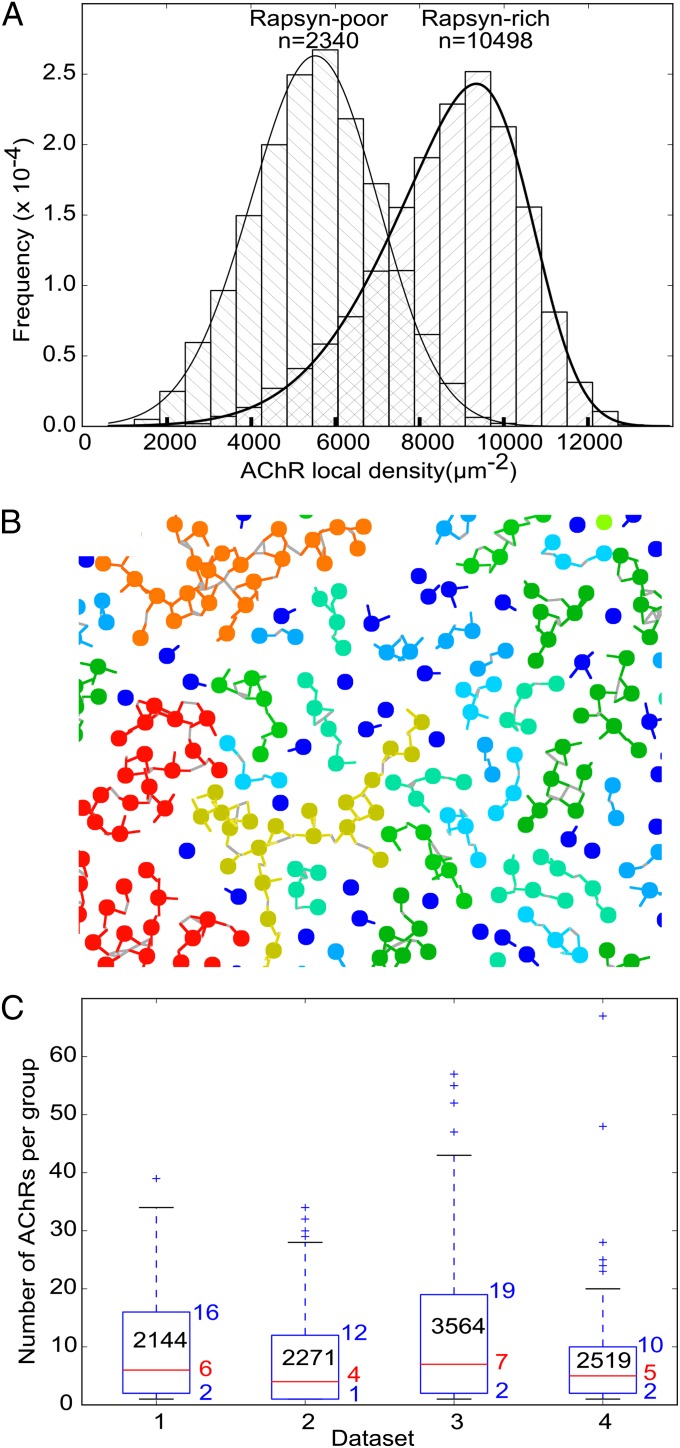
Large-scale organization of receptors and rapsyns. (A) Frequency histograms of the local concentration of receptors in rapsyn-rich and rapsyn-poor tomograms, respectively. (B) Detail of a receptor–rapsyn interaction network projected on a 2D plane. Receptors are represented as beads, and rapsyn lobes are represented as colored lines. Gray lines are drawn between contacting rapsyn lobes. The color of receptors and rapsyns is related to the size of the groups [from dark blue (single receptor) to red (>50 receptors)]. (C) Boxplots of the size of the group of rapsyn-connected receptors to which each receptor belonged. One boxplot is shown per rapsyn-rich dataset. The lower and upper edges of the boxes represent the 25th and 75th percentiles, respectively, whereas the red lines represent the median. The corresponding numerical values are written next to the boxes. The number of receptors in each area of investigated postsynaptic membrane is reported in the boxes. The whiskers extend to the most extreme data point comprised within ranges d1 = [p25 − 1.5 × (p75 – p25), p25] and d2 = [p75, p75 + 1.5 × (p75 – p25)], where p25 is the 25th percentile and p75 is the 75th percentile. More extreme values are shown as crosses.

