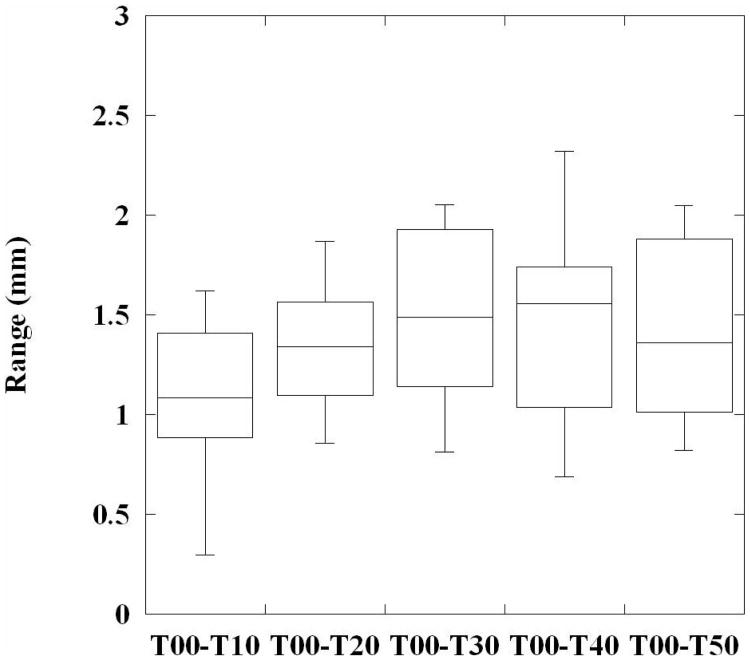
Figure 6. Phase-step registration errors.
A box plot is shown illustrating the range of 4DLTM cubic magnitude registration errors at each phase increment. The 75 sampled 4D reference trajectories for each case were combined to pool the measured errors, resulting in 750 error measurements for each phase bin.

