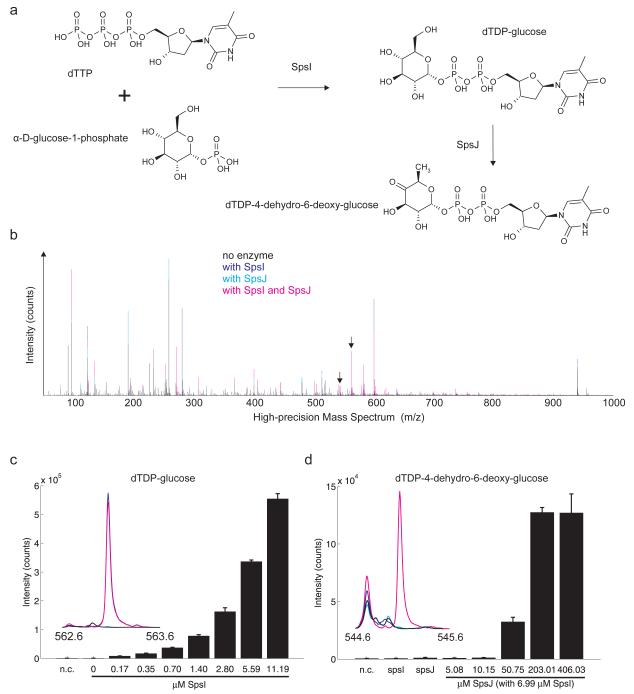
Figure 3. In vitro biochemical assays used to characterize activities of SpsI and SpsJ using high-precision mass spectrometry.
(a) Reaction diagram. (b) Mass spectrum plot showing intensities for masses corresponding to the products dTDP-glucose and dTDP-4-dehydro-6-deoxy-glucose of the reactions catalyzed by SpsI and SpsJ (black arrows, detailed in panel c). Observed masses deviated by less than 0.001 atomic mass units (amu) from the corresponding reference masses. Spectra were recorded from two independent assays. (c, d) Bar plots show dependency of dTDP-glucose and dTDP-4-dehydro-6-deoxy-glucose accumulation on protein concentration of SpsI and SpsJ, respectively. As negative control (n.c.), the protein free filtrate of 6.99 μM spsI or 203.01 μM SpsJ solution was used. Error bars represent standard deviations calculated using two independent assays.

