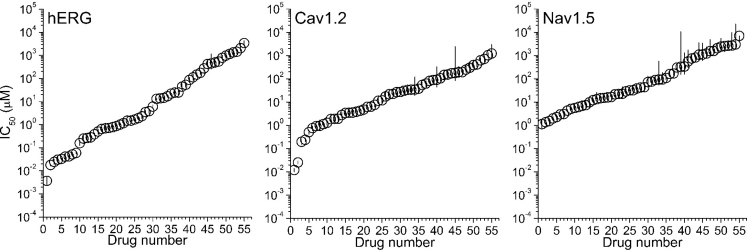
Figure 1. IC50s of the 55 drugs included in the dataset for hERG, Cav1.2 and Nav1.5.
Symbols indicate mean values and lines the 95% confidence intervals of data. Values for the three channels are plotted as a function of drugs numbered in decreased order of potency. The drug order for each channel is indicated in Supplementary Table 3.

